Quick walkthrough video
Watch this quick walkthrough video to get started:Data exploration and visualization
The plugin uses Superset as a free data exploration and visualization tool. Use the suggested query structure and logic to ensure accurate reporting and avoid duplicates, even during database updates. Do not just use select on single reporting tables.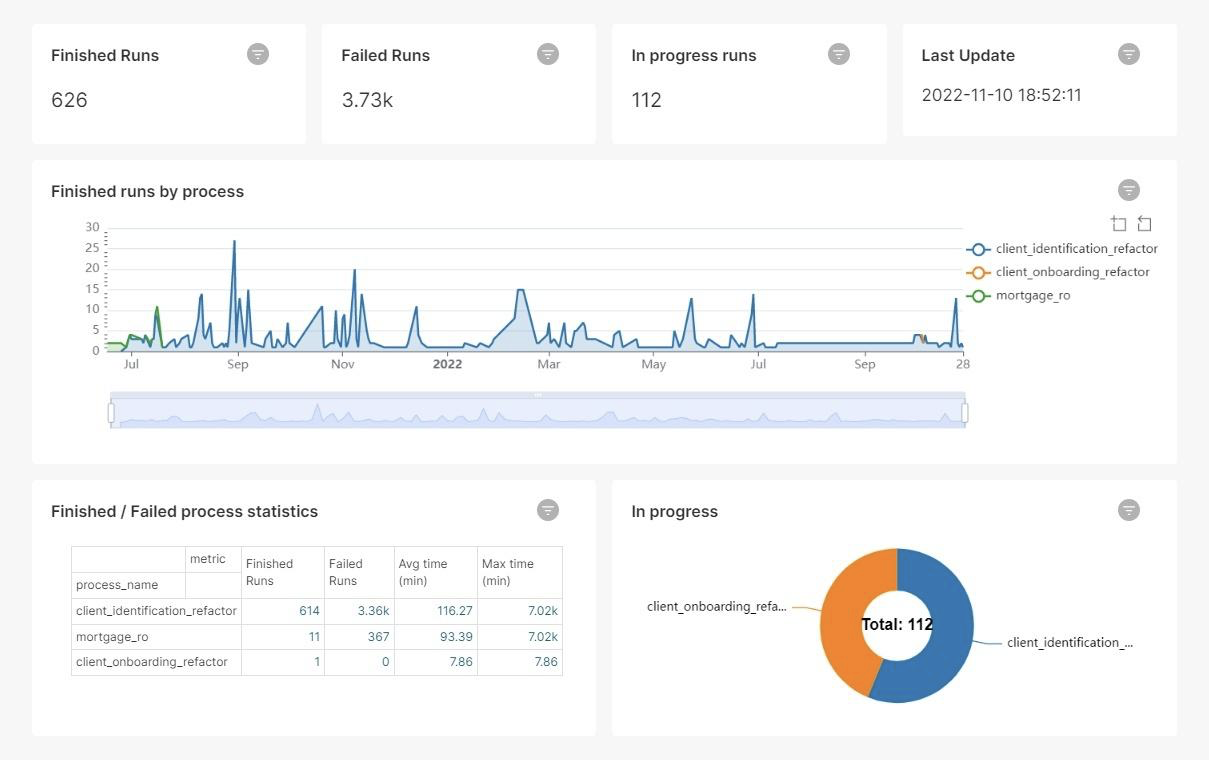
Superset documentation
Plugin architecture
Here’s an overview of the reporting plugin architecture: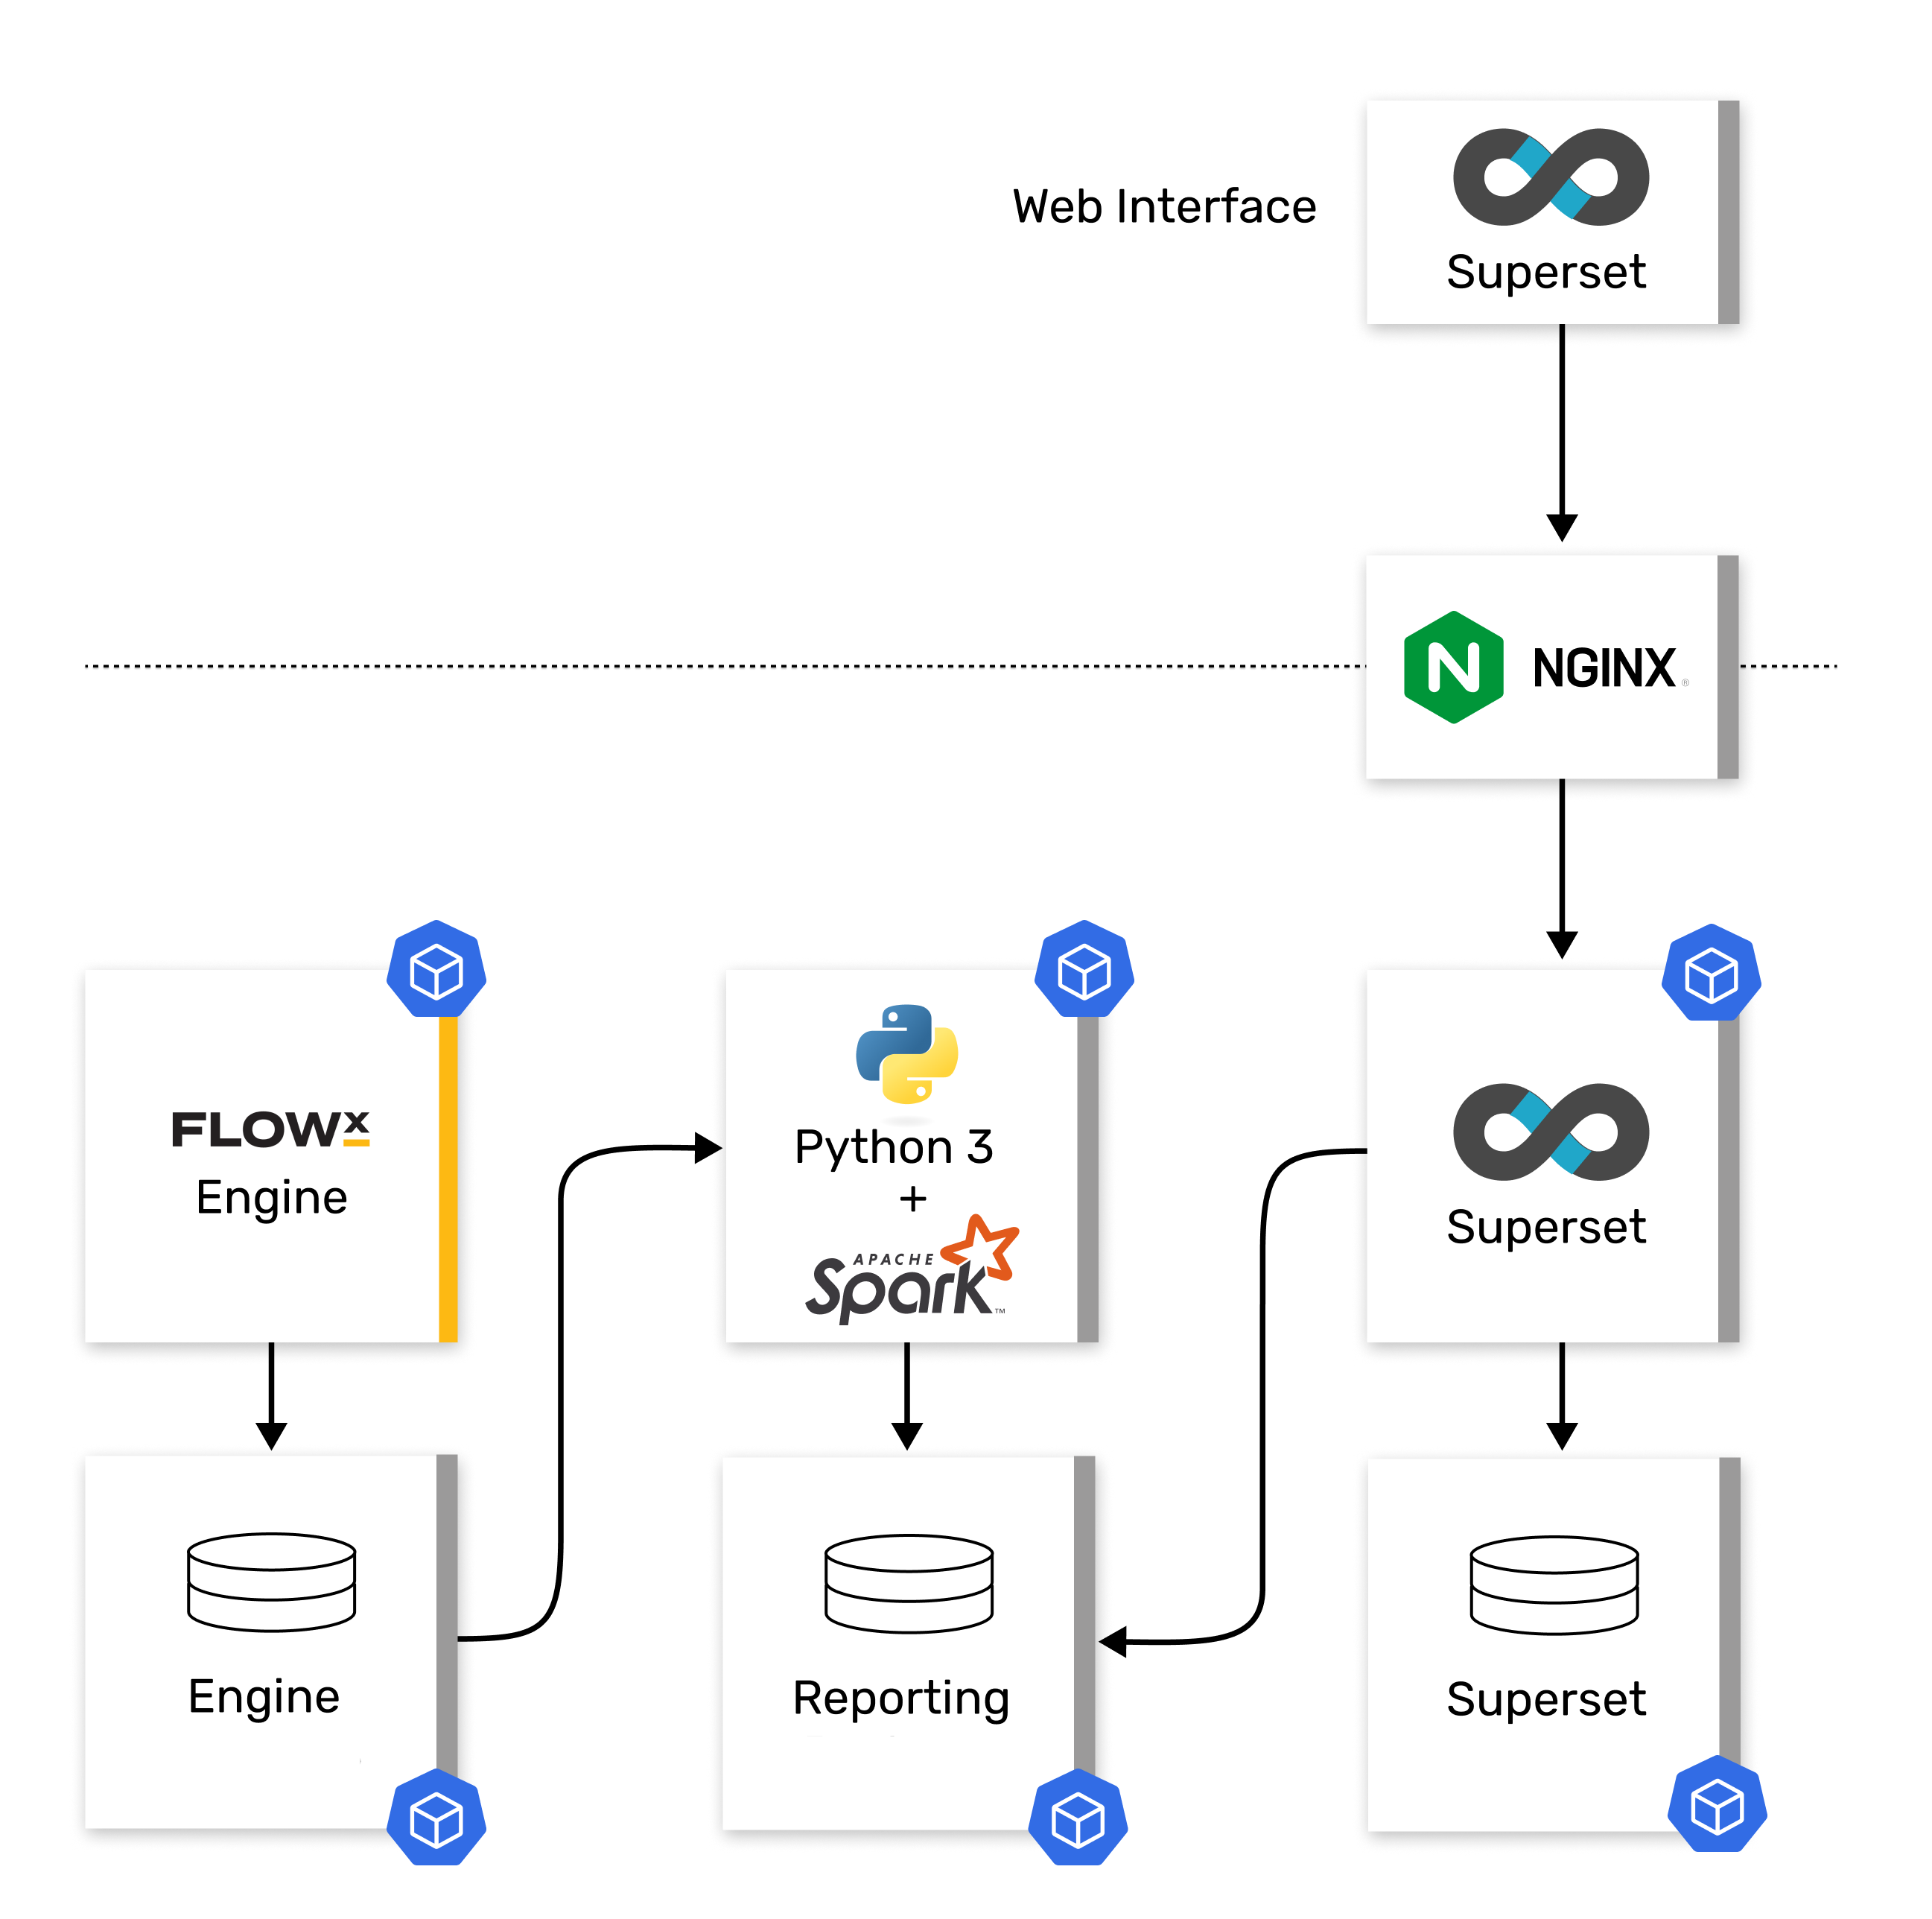
Setting up reporting for a process definition
1
Establish reporting data model to be extracted from process
If you want to extract custom business parameters for a process, first you should set up the master reporting data model in the published version of that process. This is done in Designer, as explained below in the Reporting Data Model.The master reporting data model that is applied to all historical versions is the one belonging to the version that is set as Published. If the currently published version is read-only, you might need to create a new version, create the data model in it, mark it for reporting and set it as published (as explained in the section below).See Reporting Data Model section for more details.
2
Enable reporting on the process versions to be reported
This is accomplished by checking the “Use process in reporting” button in the settings / general page of each process version you want to report. Please note that you will not be able to change that setting on read-only versions.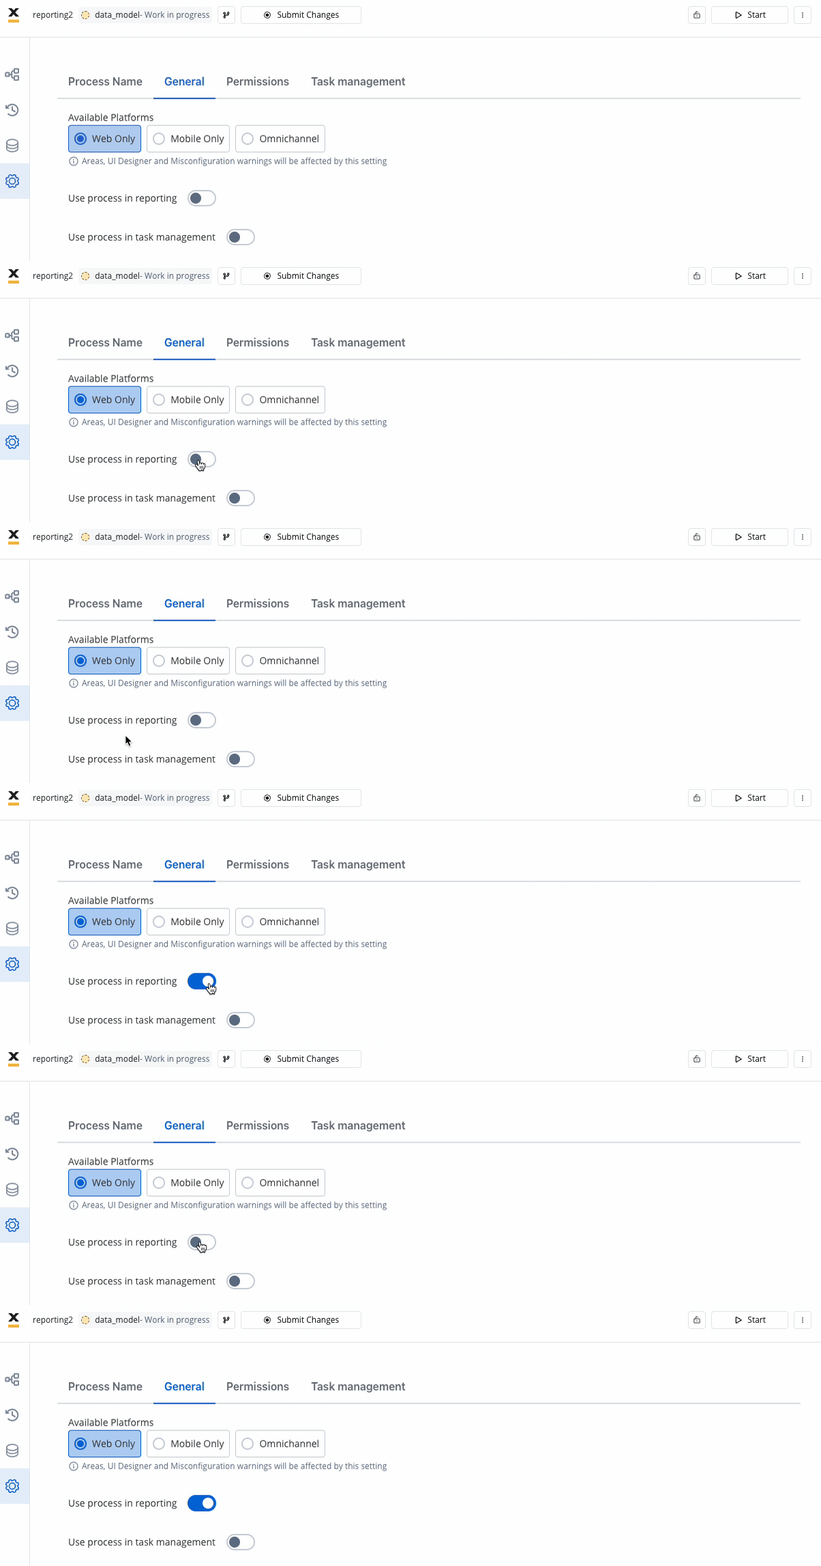 It is essential that the currently Published version has this setting enabled, as it is the master version for reporting all historical data.Only the process instances belonging to reporting-enabled versions will be extracted to the database, using the master data model from the currently Published version.To optimize operations, you should always aim to finish the modifications on the master data model on a version that is either not published, or not marked as “use_in_reporting”, before marking it as “use_in_reporting and ensuring it is published.See Enabling Process Reporting section for more details.
The reason why you should first set up the data model on the published (or to-be-published) version is that all changes in the data model of the published version that is also marked “use_in_reporting” are instantly sent to the reporting plugin, potentially causing all historical process instances to be re-computed multiple times before you are done setting up the data model.
Reporting data model
You can only create or modify the reporting data model in non-committed versions, as committed versions are read-only.
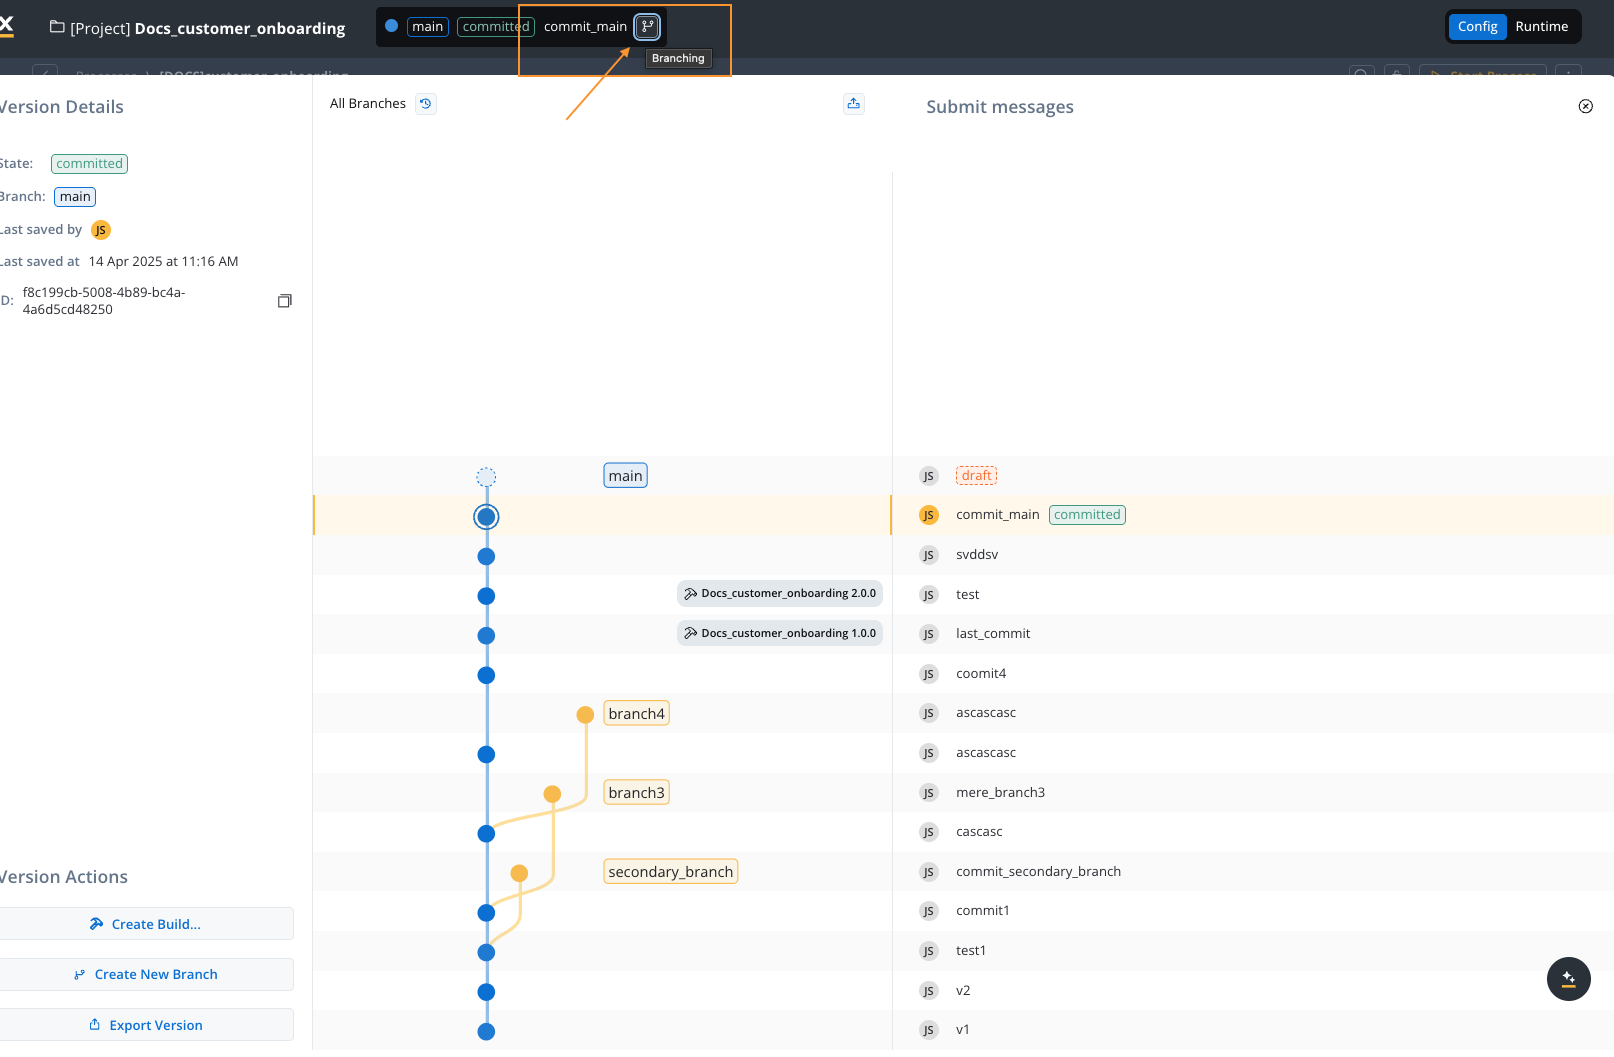
- Open the branch view.
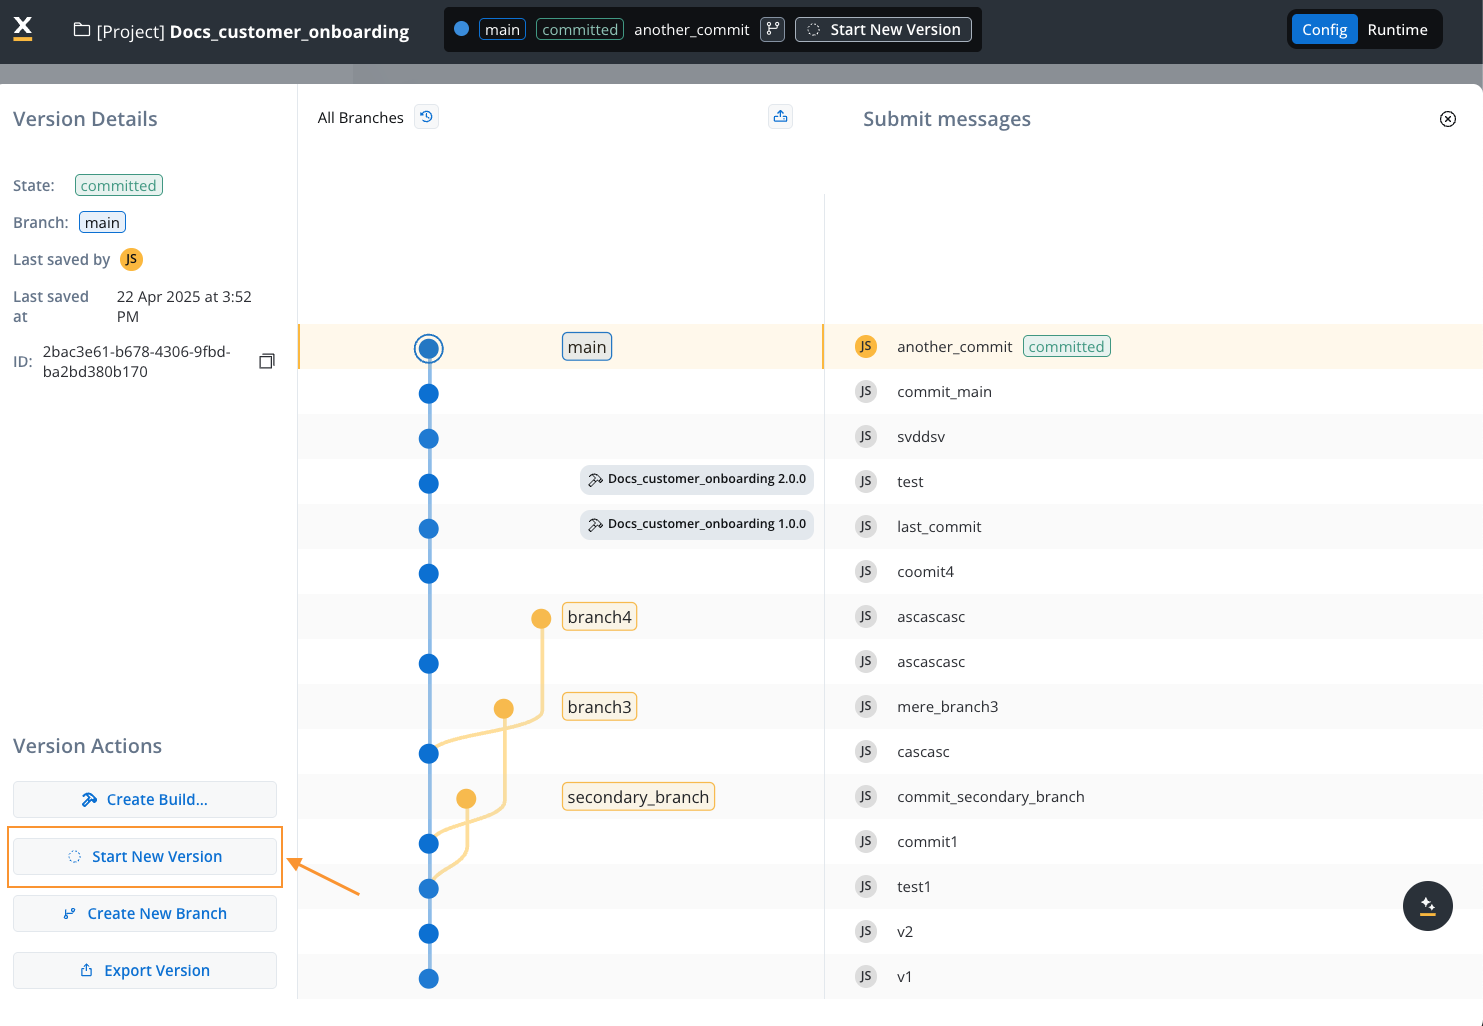
- If the current project version is committed, start a new version.
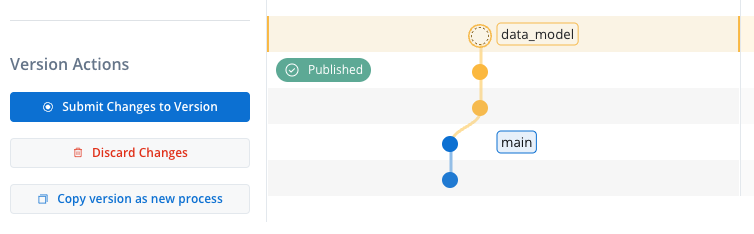
- Make sure the new work-in-progress branch is selected, then go back to the process definition page.
- Click on the Data Model icon and navigate in the object model to the target parameters.
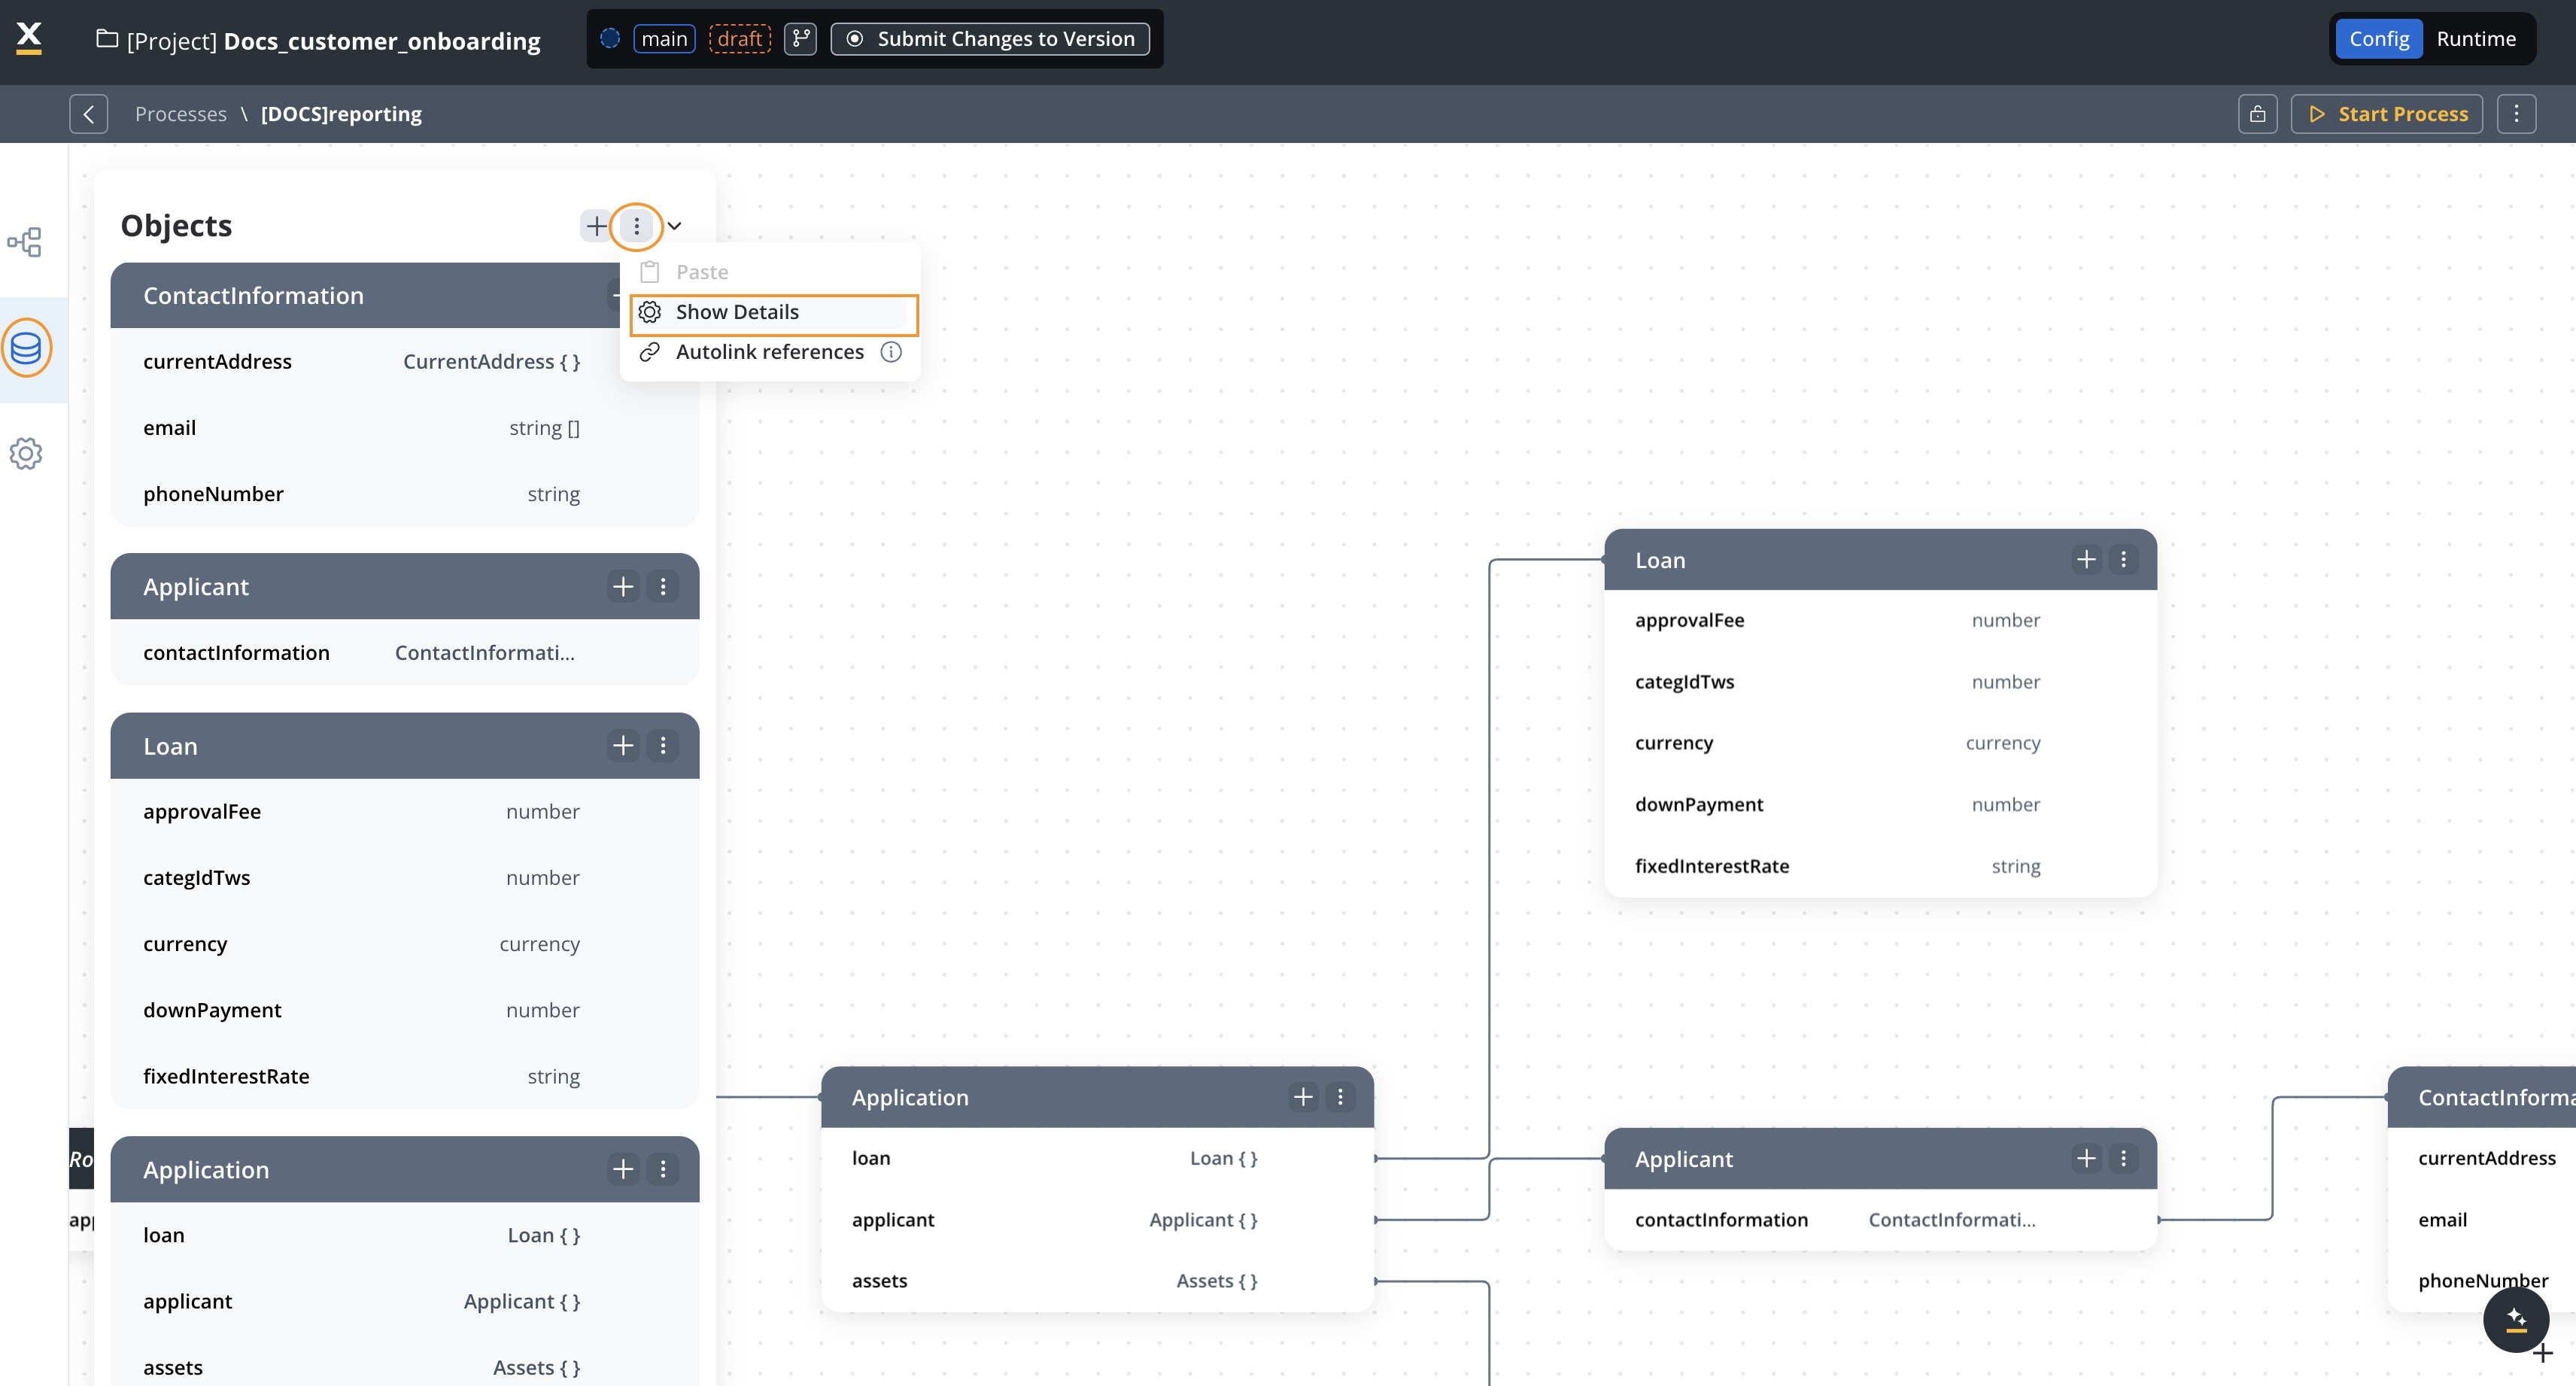
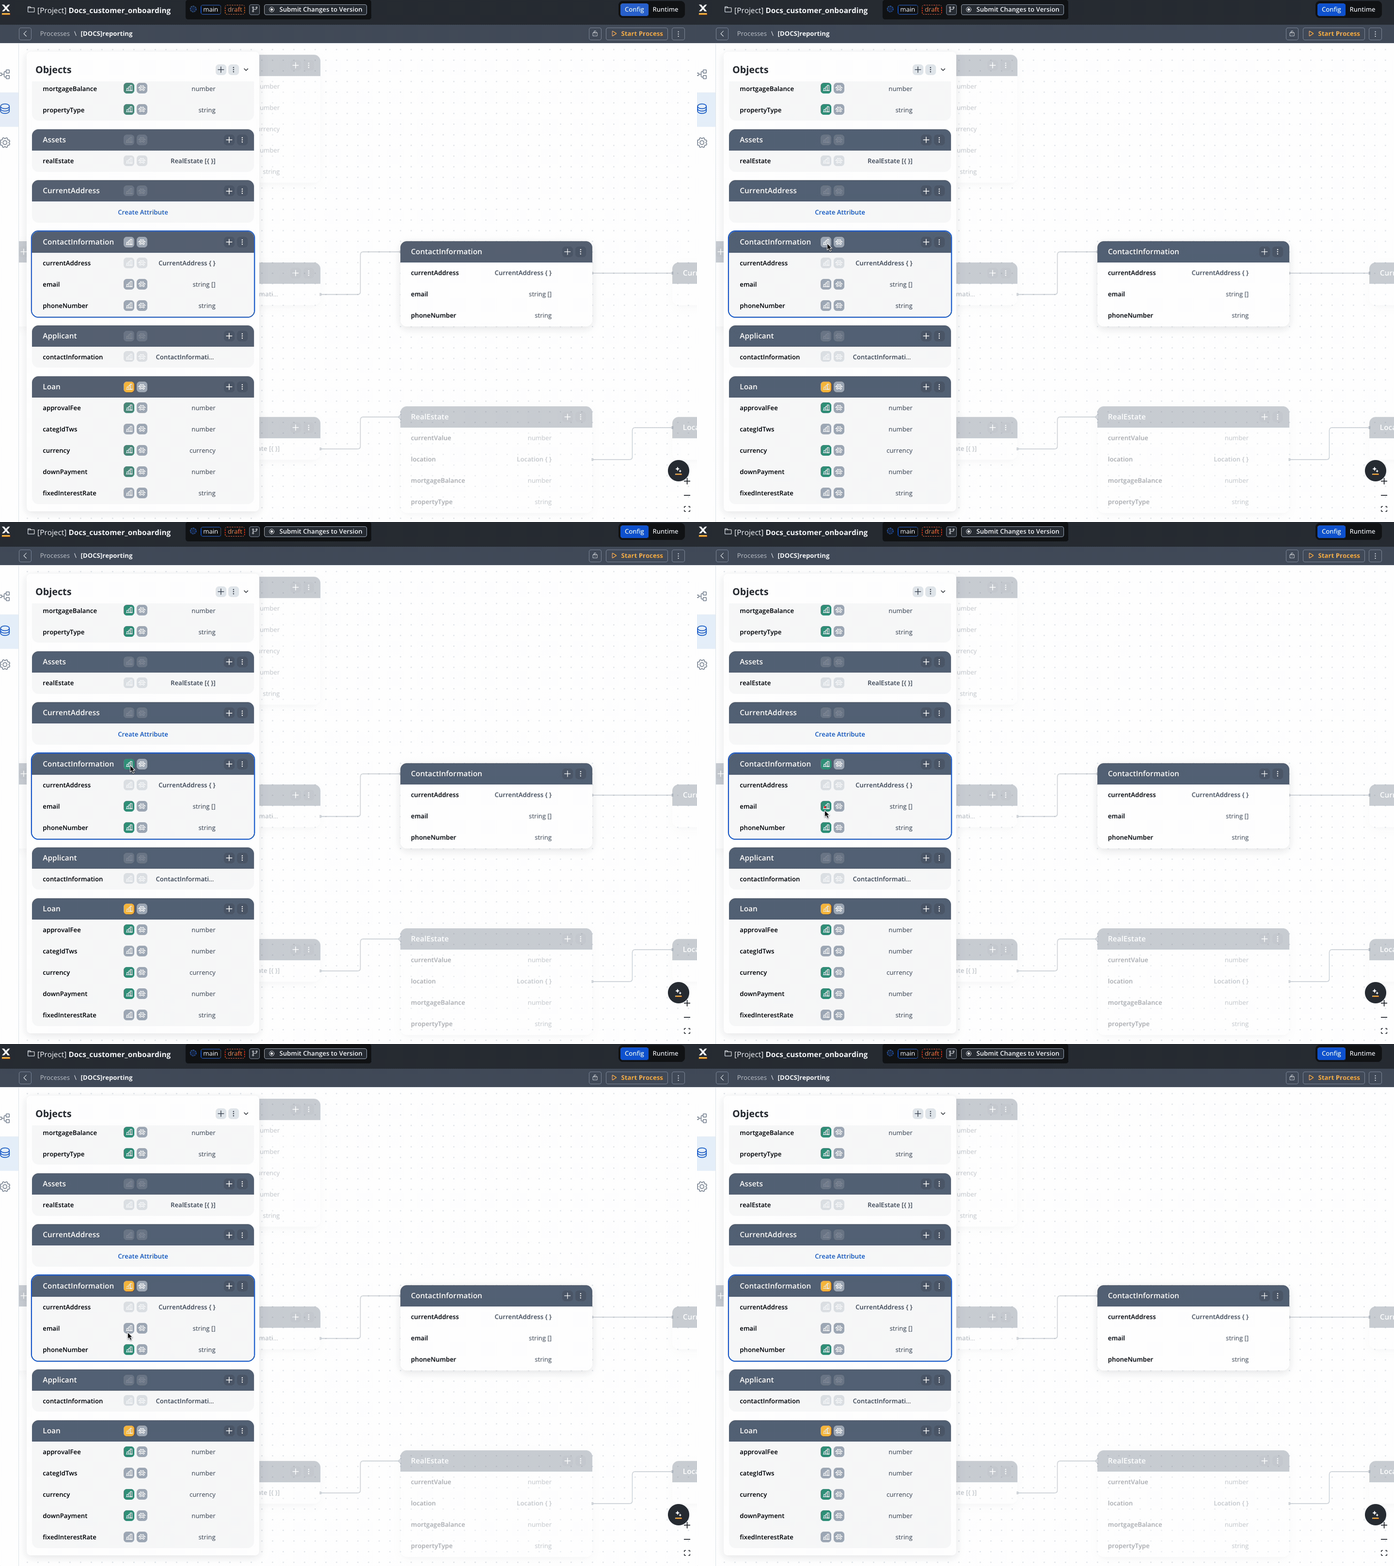
- Set up the business data structure to be reported by using the “Use in reporting” flag.
- Click “Show details”.
- Click “Use in reporting”.
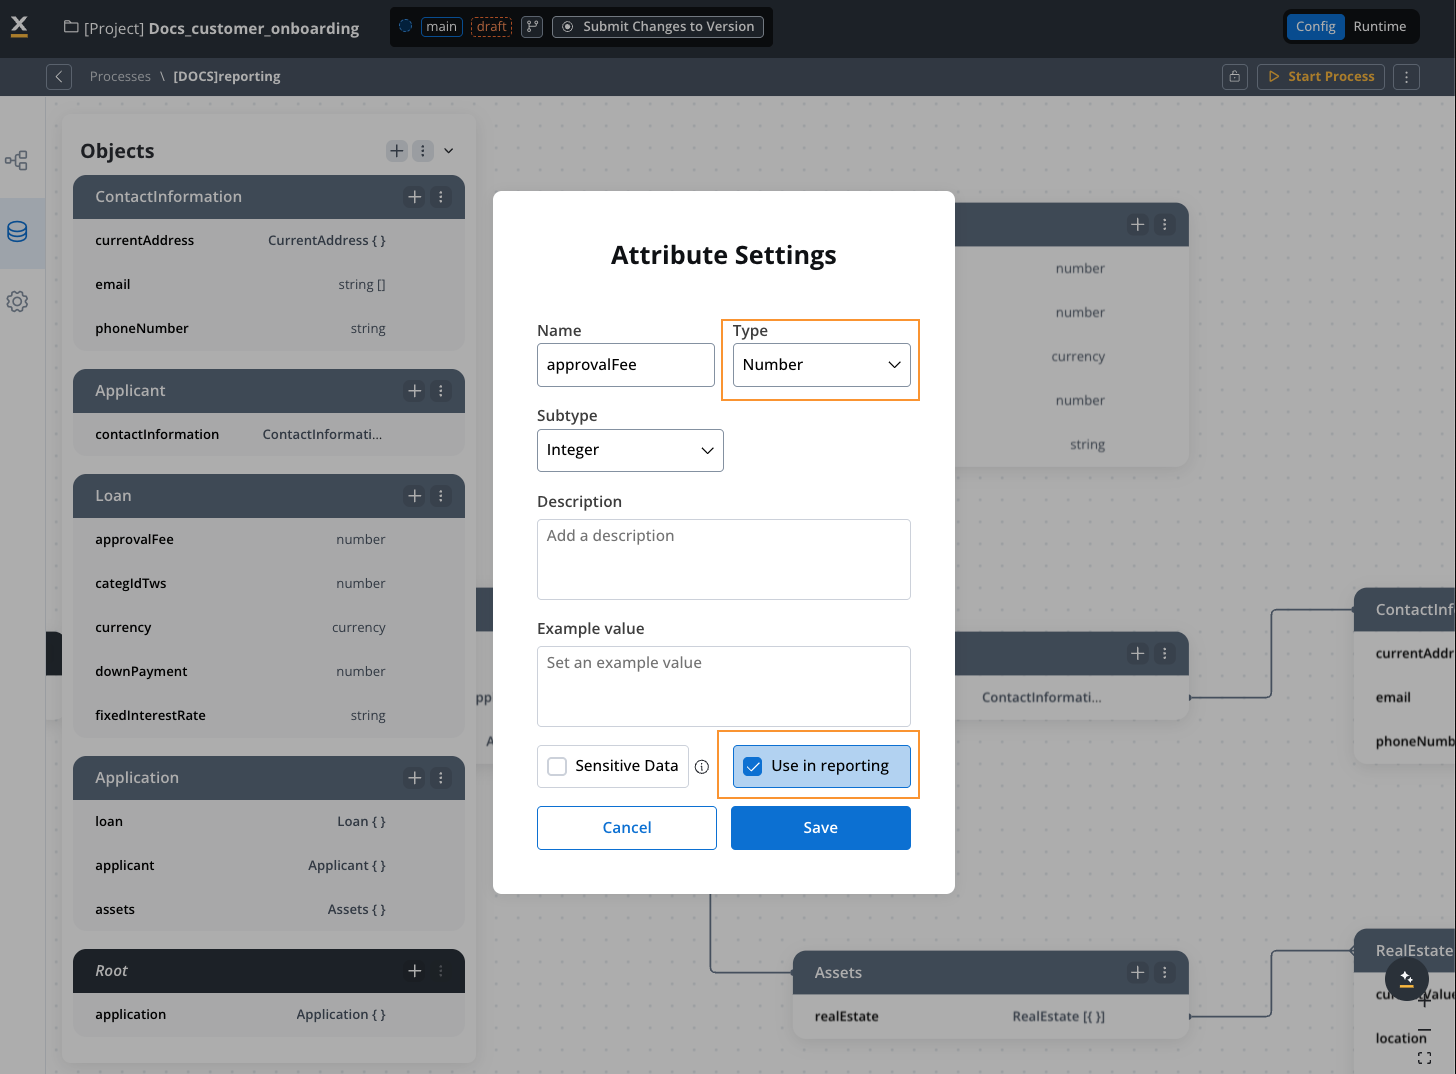
There are three parameter structures that you can report:Singleton or primitive, for which a single value is saved for each process instance. They can be of the types number, string, Boolean or date, and will all be found in the reporting table named
params_{process_alias}. Date and zoned date-time attributes are reported as timestamp columns; any other type is reported as a string.Array of primitives, in which several rows are saved for each process instance, in a dedicated table (one value per row).Array of objects, in which the system extracts one or more “leaves” from each object of an array of objects. Also saved as a dedicated table.Primitive parameters reporting
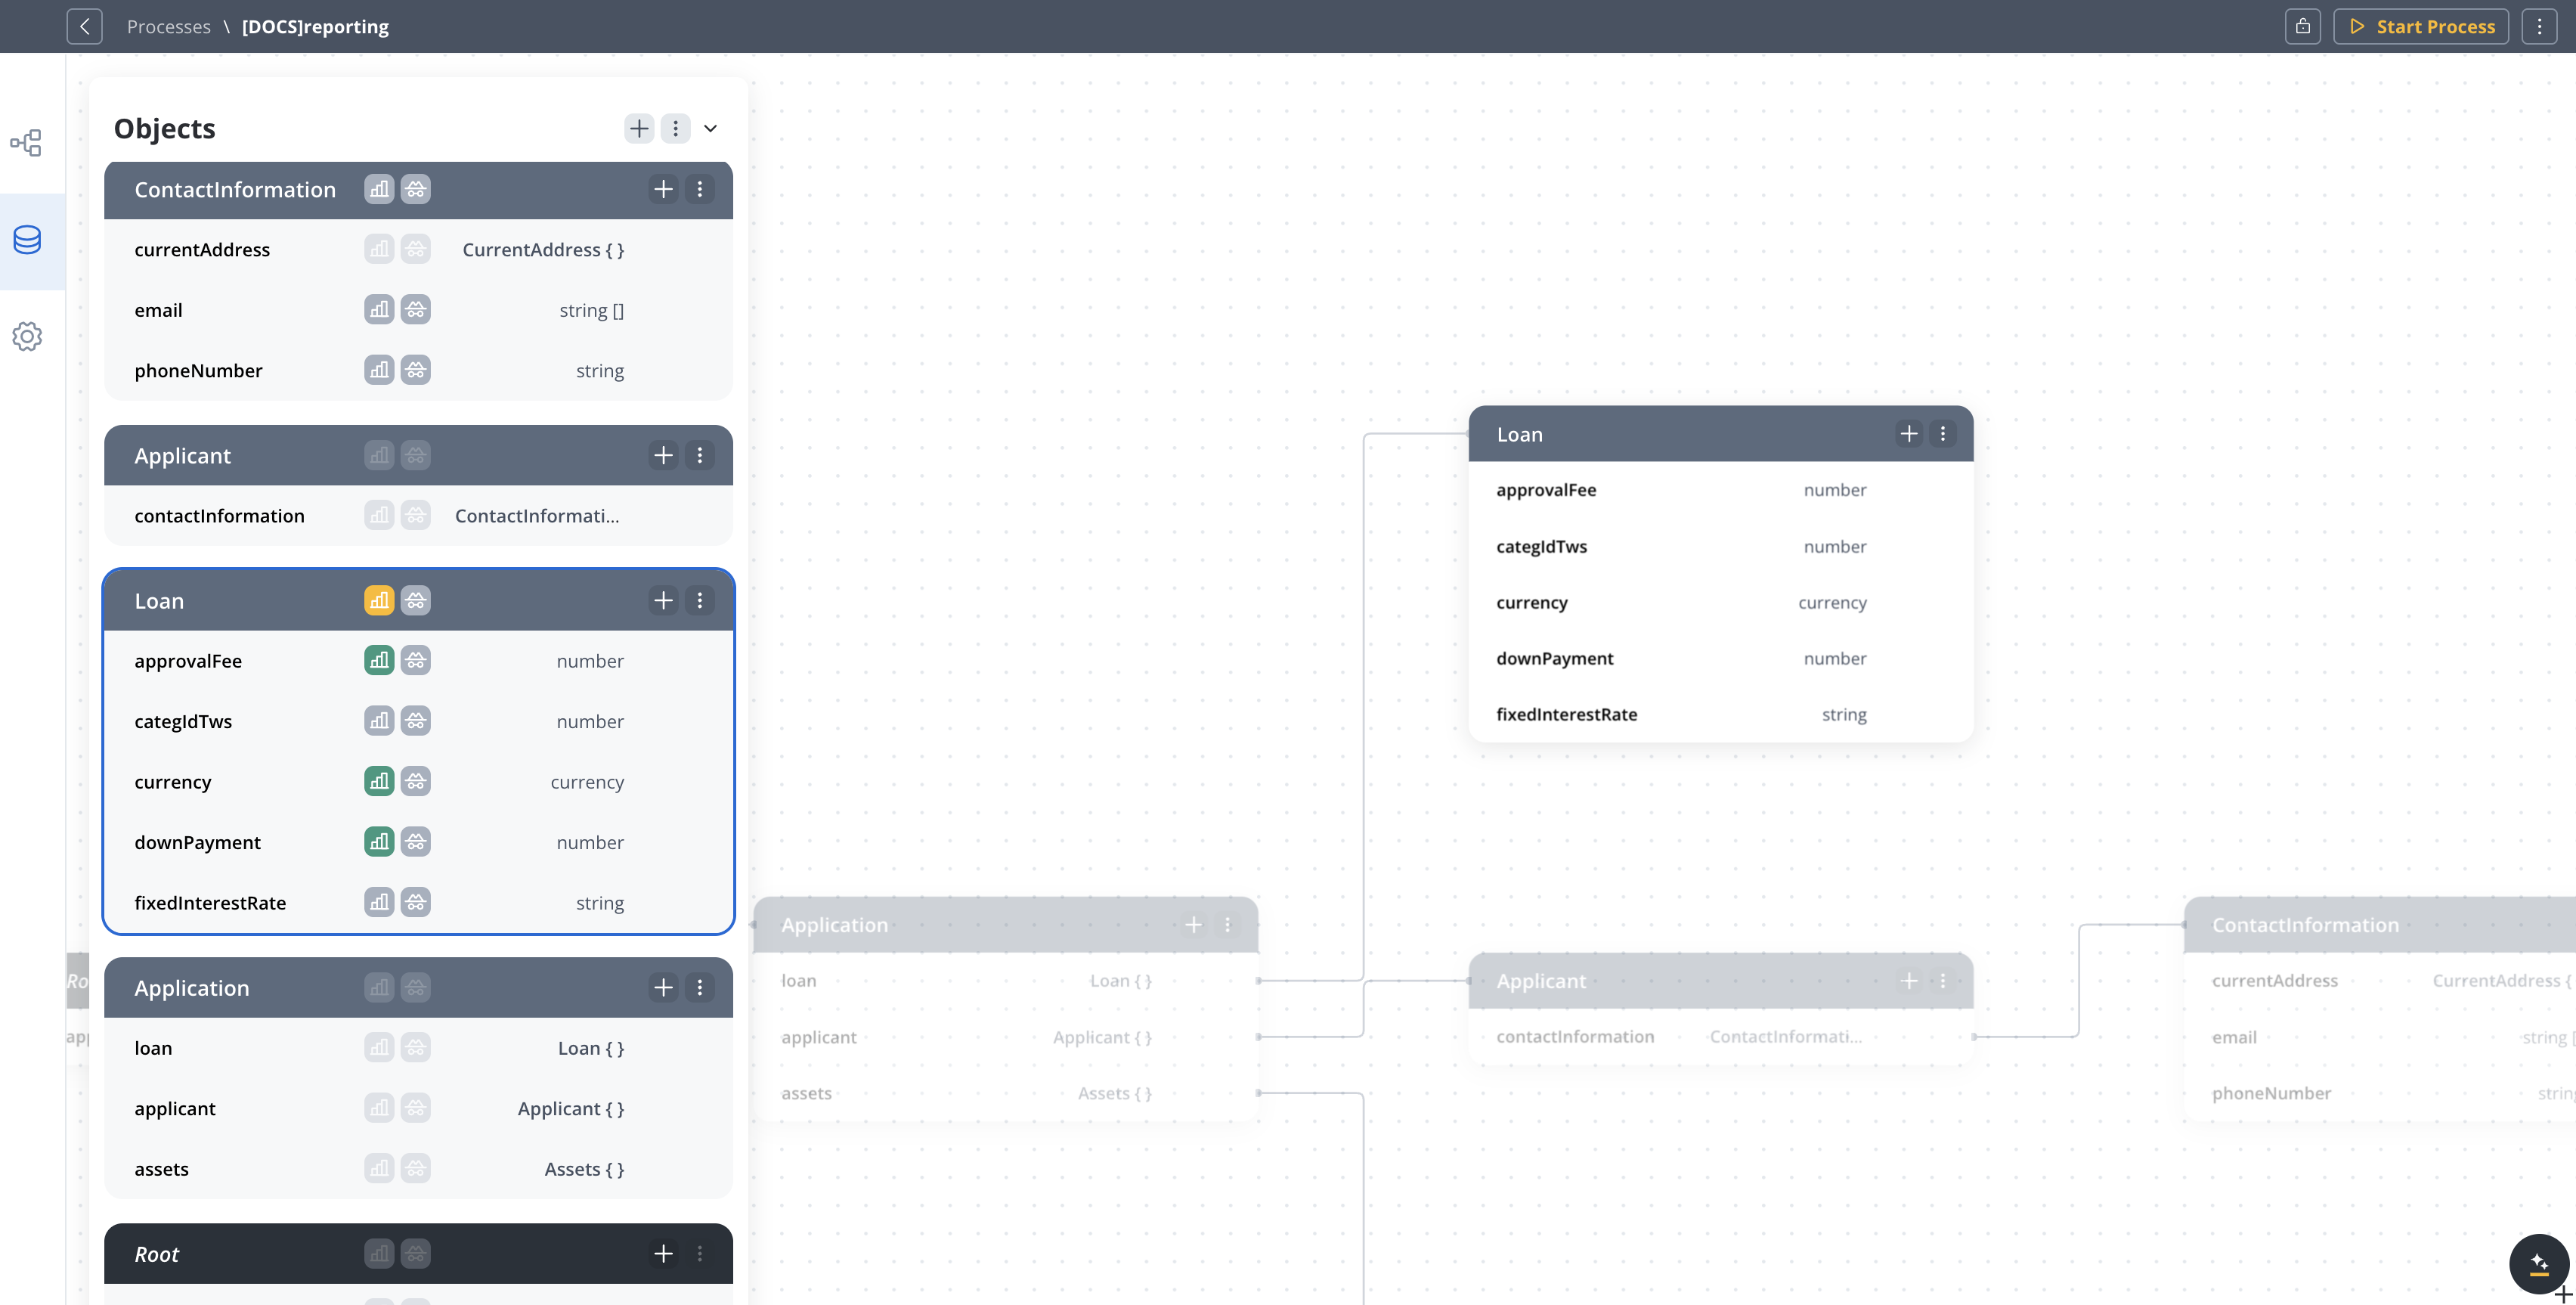
In the following example, there are 3 simple parameters that will be extracted:loan_approvalFee, loan_currency and loan_downPayment.
They will be reported in the table params_{process_alias}, one row per instance.
Arrays of primitives reporting
In the following example, the applicant can submit more than one email address, so each email will be extracted to a separate row in a dedicated table in the reporting database.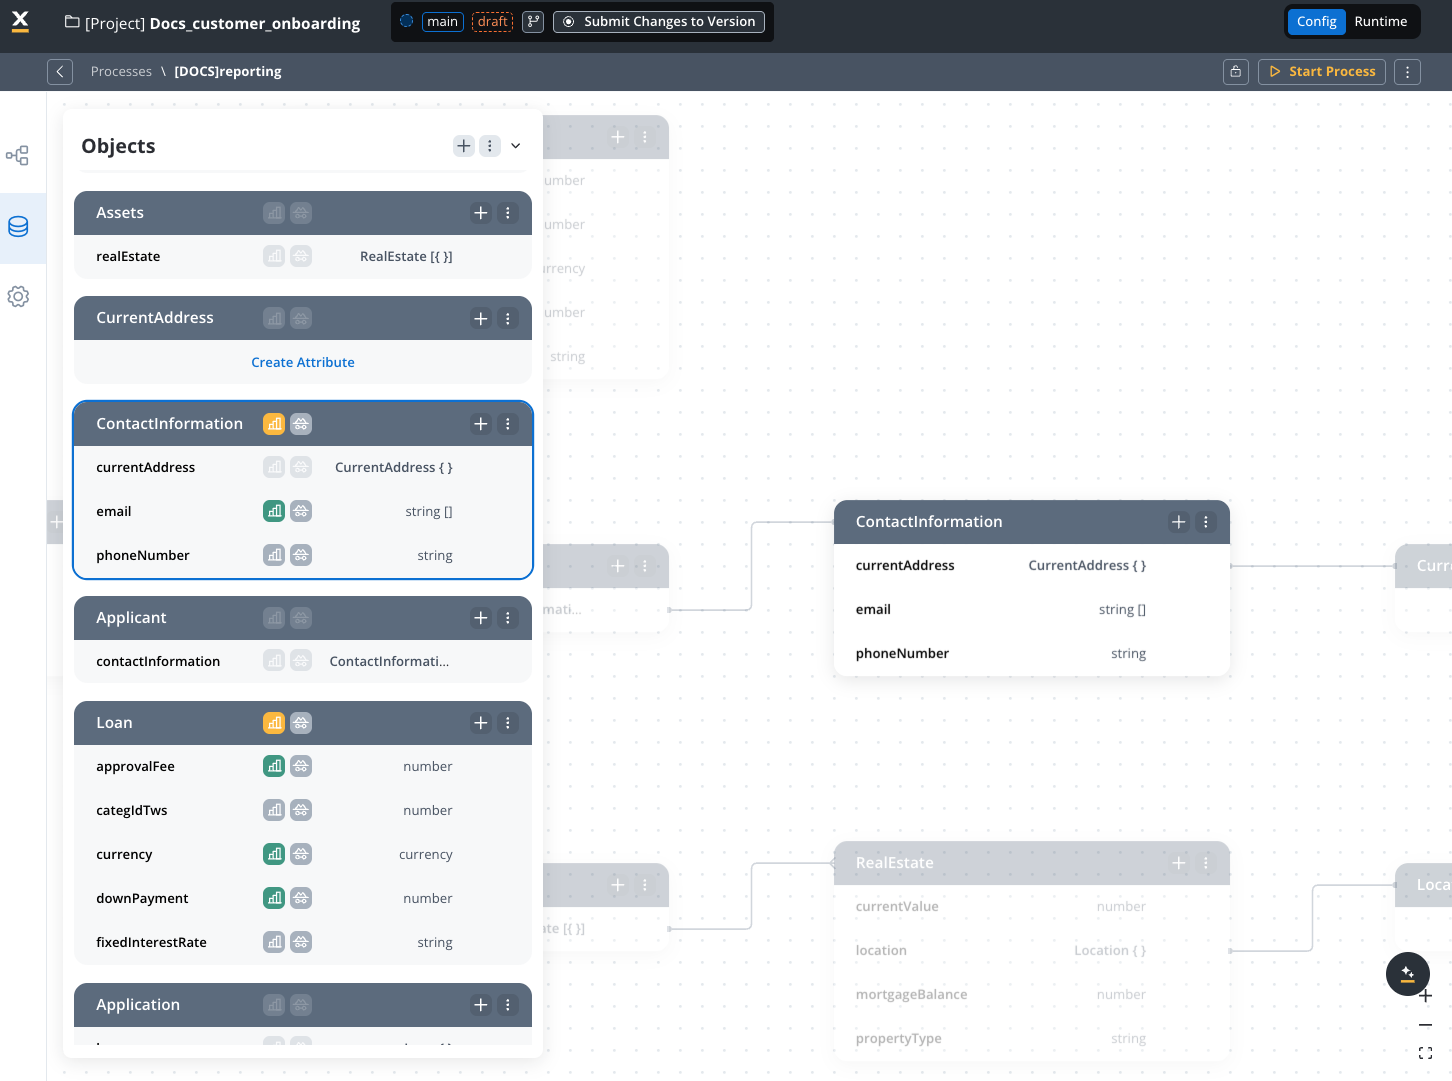
Array of objects reporting
In this example, the applicant can have several real estate assets, so a subset of data items (currentValue, mortgageBalance, propertyType) will be extracted for each one of them.
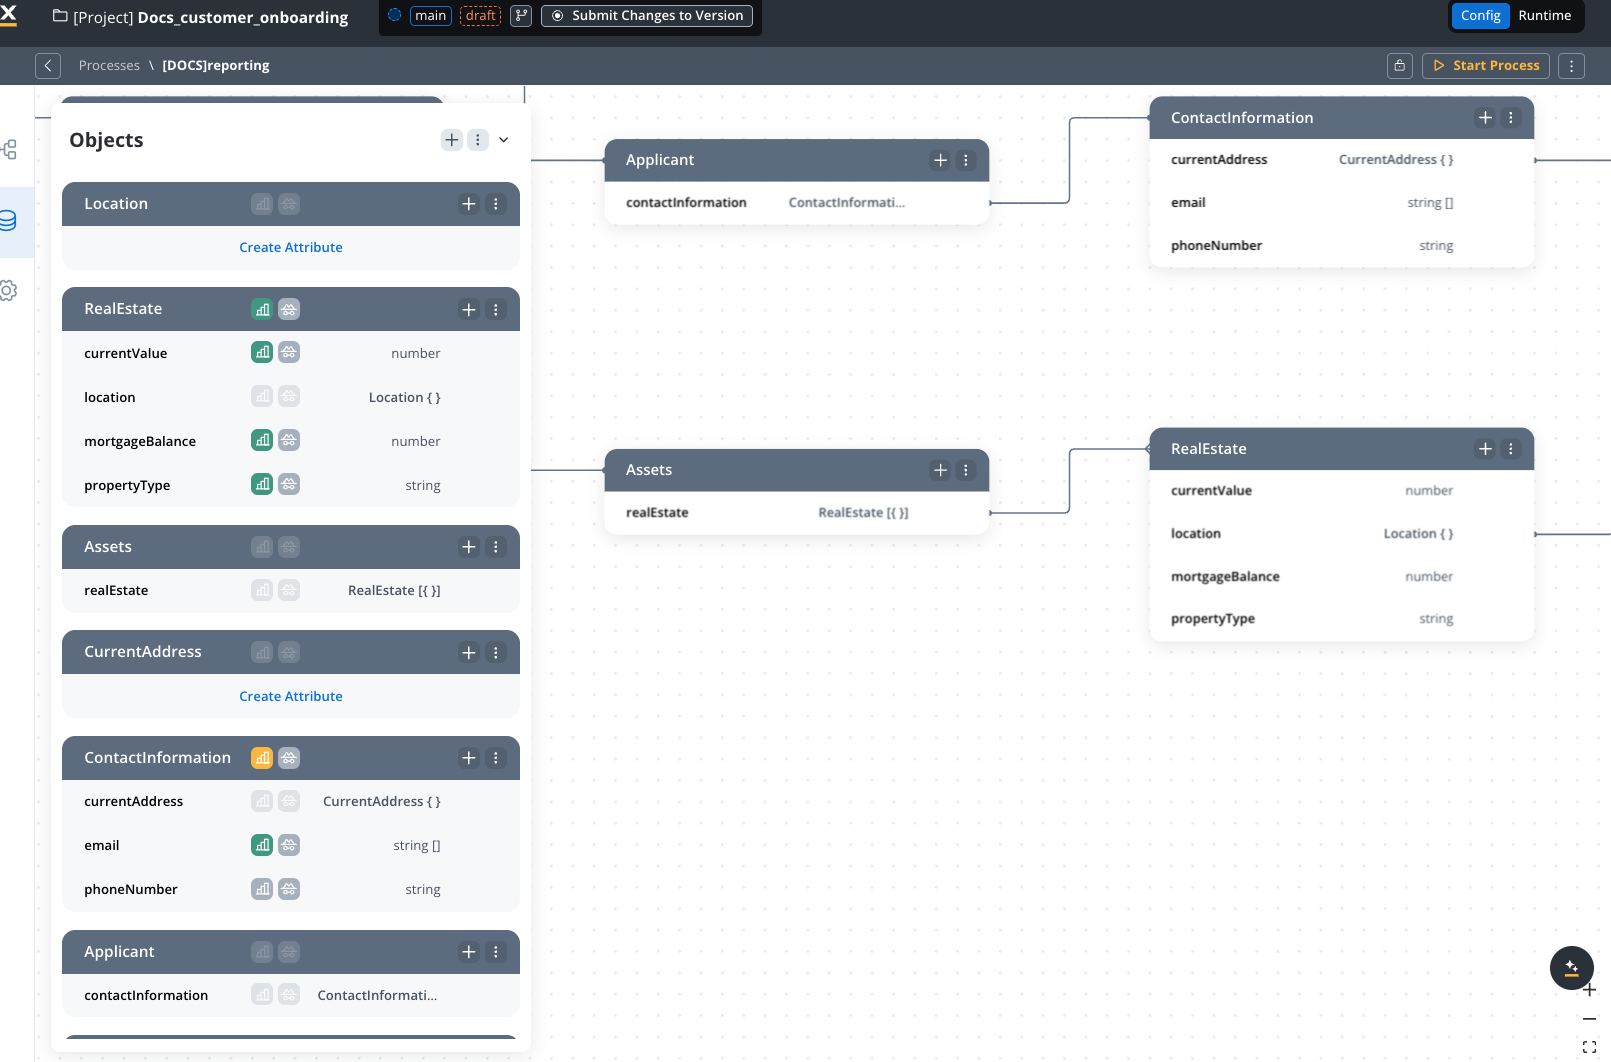
Enabling process reporting
Enable reporting by checking the “Use process in reporting” button on the settings/general page of each process.- Modifying the data model of a process version has no impact until the moment the version or build of the project is set in the “Active policy” tab and is also set to “use_in_reporting”.
- No processing overlaps are allowed. If processing takes more than 5 minutes, the next processing is automatically postponed until the current one is finished.
- The reporting plugin chooses the number of Spark executors at each run, based on the volume of data to be processed: one executor for small deltas, up to the configured maximum for large ones. It does not use Spark dynamic allocation, and the
instancesvalue in the chart is only the driver’s starting point. - Rebuilding the whole history for a process (if the master data model, process name or the Published version change) typically takes more time. It is better to make these changes after the working hours.
Reporting database
Main tables
Common fields for joins:inst_id: Unique identifier for each process instancequery_time: Timestamp for when the plugin extracts dataorganization_id,workspace_id,build_app_version_id: The organization, workspace and app version the instance belongs to
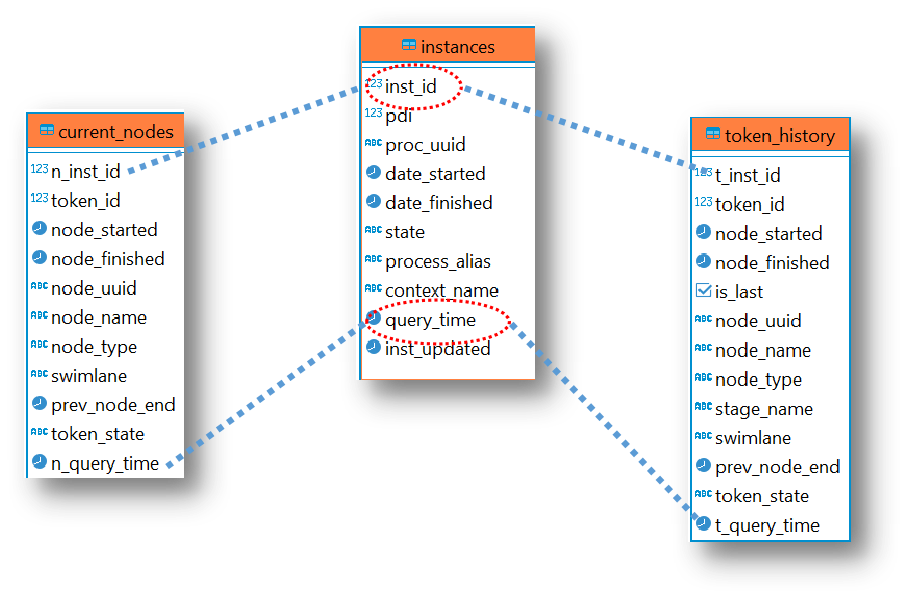
date_started/finishedtimestampsprocess_alias(process name with ”_” instead of spaces)
The published version alias will be used for all the reported versions.
- State of the process (started, finished, etc.)
context_name: Useful if the process is started by another process
node_started/finishedtimestamps for the nodesnode_name,node_typeswimlaneof the current nodeprev_node_end: For calculating when a token is waiting for another process branch
current_nodes but includes all nodes in the instance history.
Parameters and object tables
Common fields, on which the joins are built:inst_id, unique identifier for each process instancequery_time, recorded at the moment the plugin extracts data from the databaseorganization_id,workspace_id,build_app_version_id, carried on every parameter and array table
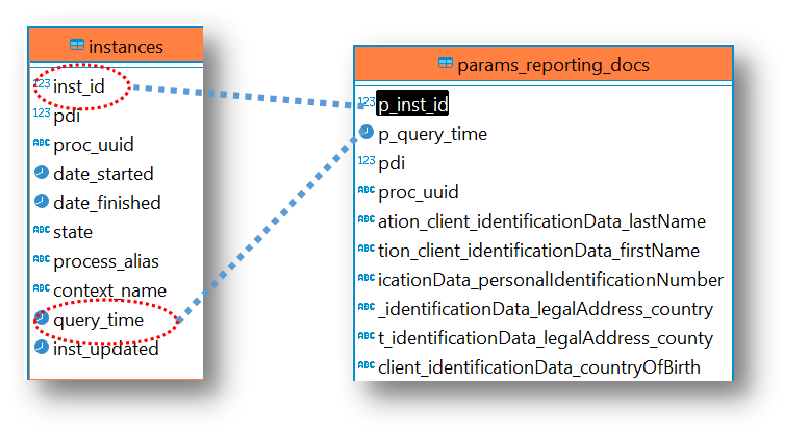
params_ table, there is a single row per process instance. For arrays and arrays of objects tables, there are multiple rows per process instance.
Reporting for UI Flows and workflows
Besides process instances, the reporting plugin extracts UI Flow sessions and integration workflow runs into the same reporting database.Turning it on
For a UI Flow, open its General settings and toggle Use UI flow in reporting ON. For an integration workflow, open its Settings and toggle Use workflow in reporting ON. As with processes, only resources that belong to the active build are extracted.How the columns are decided
Processes are reported attribute by attribute: you mark each data model attribute for reporting, and the plugin builds the columns from those definitions. UI Flows and workflows have no per-attribute marking. The plugin infers the structure from the data itself on every run, so each variable present in a session or a token becomes a column, and every array is exploded into its own child table.Because the structure is inferred rather than declared, the columns follow whatever the data contains. Renaming or restructuring variables changes the columns on the next run.
UI Flow tables
uiflow_sessions also carries app_uiflow_id, resource_id, status, uf_started and uf_updated.
For a session that is still in progress,
uf_updated falls back to the start date, because the engine only stamps the update date when a session finishes.Workflow tables
wf_instances also carries app_workflow_id, workflow_resource_id, wf_status, wf_started and wf_finished. wf_tokens adds token_status and wf_updated, and links to its instance through wf_inst_uuid.
The same naming difference applies here: the token identifier is token_uuid in wf_tokens and wf_token_id in the parameter and array tables.
Every table listed above also carries organization_id, workspace_id and build_app_version_id.
Array table names are truncated to 64 characters, so deeply nested branches with long names can produce shortened table names.
Using Superset for data exploration
Data sources
The Data tab represents the sources of all information:- Databases
- CSV files
- Tables
- Excel files
Charts
Charts represent the output of the information. There are multiple visualization charts/ plugins available.Dashboards
With the use of dashboards, you can share persuading flows, show how metrics change in various scenarios and match your company efforts with logical, evidence‐based visual indicators.Datasets
Contains all the information for extracting and processing data from the DB, including SQL queries, calculated metrics information, cache settings, etc. Datasets can also be exported / imported.Connecting to a database
Before using Superset, ensure you have a PostgreSQL database installed and configured. Follow these guides for setup: FlowX Engine DB configuration Reporting DB configurationRead-only users should be used in production in the reporting-plugin cronjob.
- From the Toolbar, hover your cursor over the ”+” icon, then select Data, and then select Connect Database.
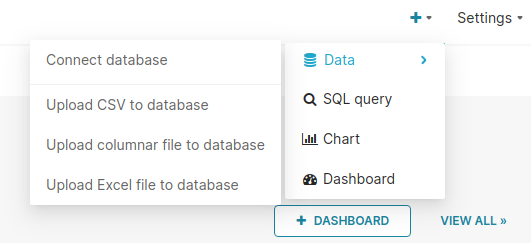
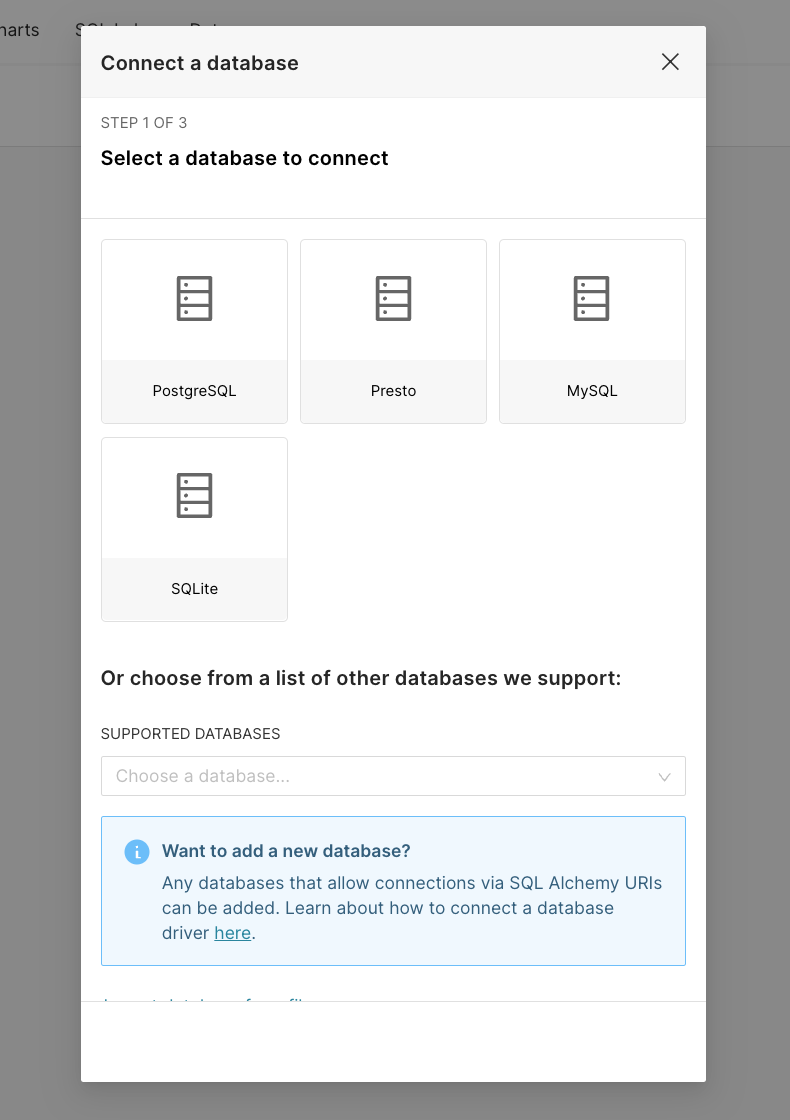
- The Connect a database window appears. Select the appropriate database card (in this case - PostgreSQL).
- After you selected the DB, click Connect this database with a SQLAlchemy URI string instead?.
- Fill in the SQLALCHEMY URI and then click Connect.
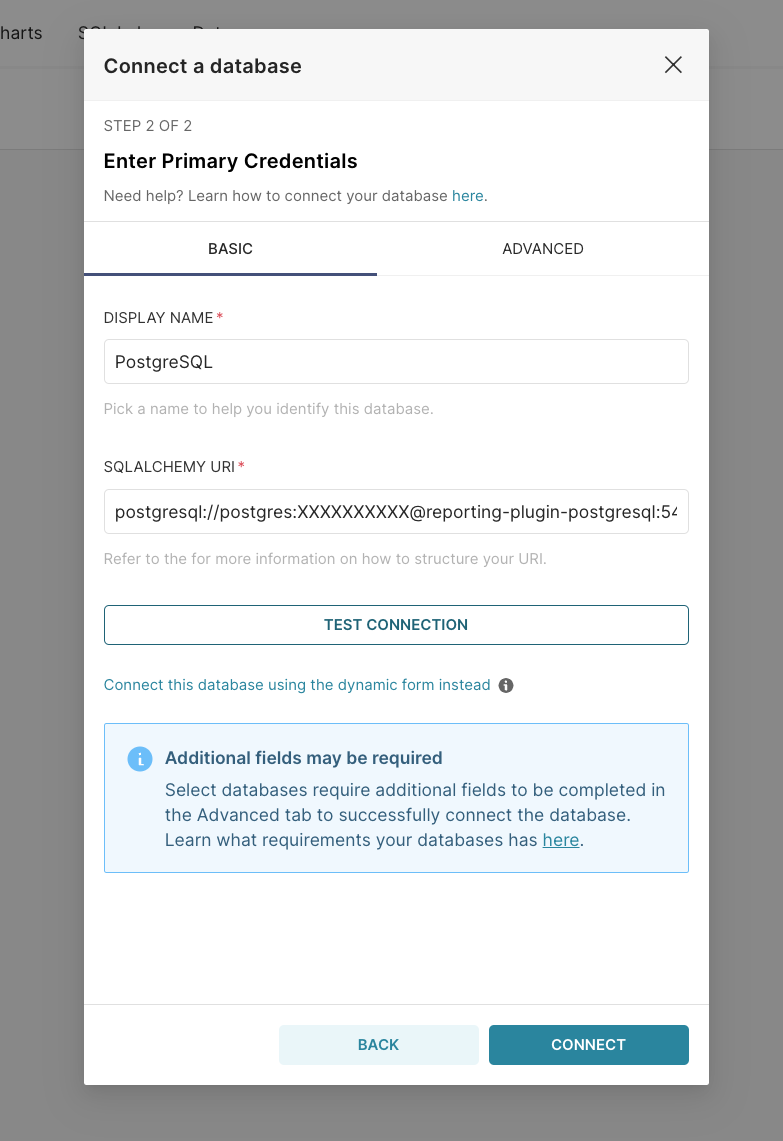
The SQLAlchemy URI for reporting-db should be in this format:
postgresql://postgres:XXXXXXXXXX@reporting-plugin-postgresql:{{port}}/reporting.Creating and configuring charts
There are multiple ways in which you can create/configure a chart.Creating charts using Datasets tab
To create a Chart using the first method, you must follow the next steps:- From the top toolbar, select Data and then Datasets.
You need to have a dataset added to Superset first. From that particular dataset you can build a visualization.
- Select the desired dataset.
- On the explore page, choose the visualization type and click Create chart.
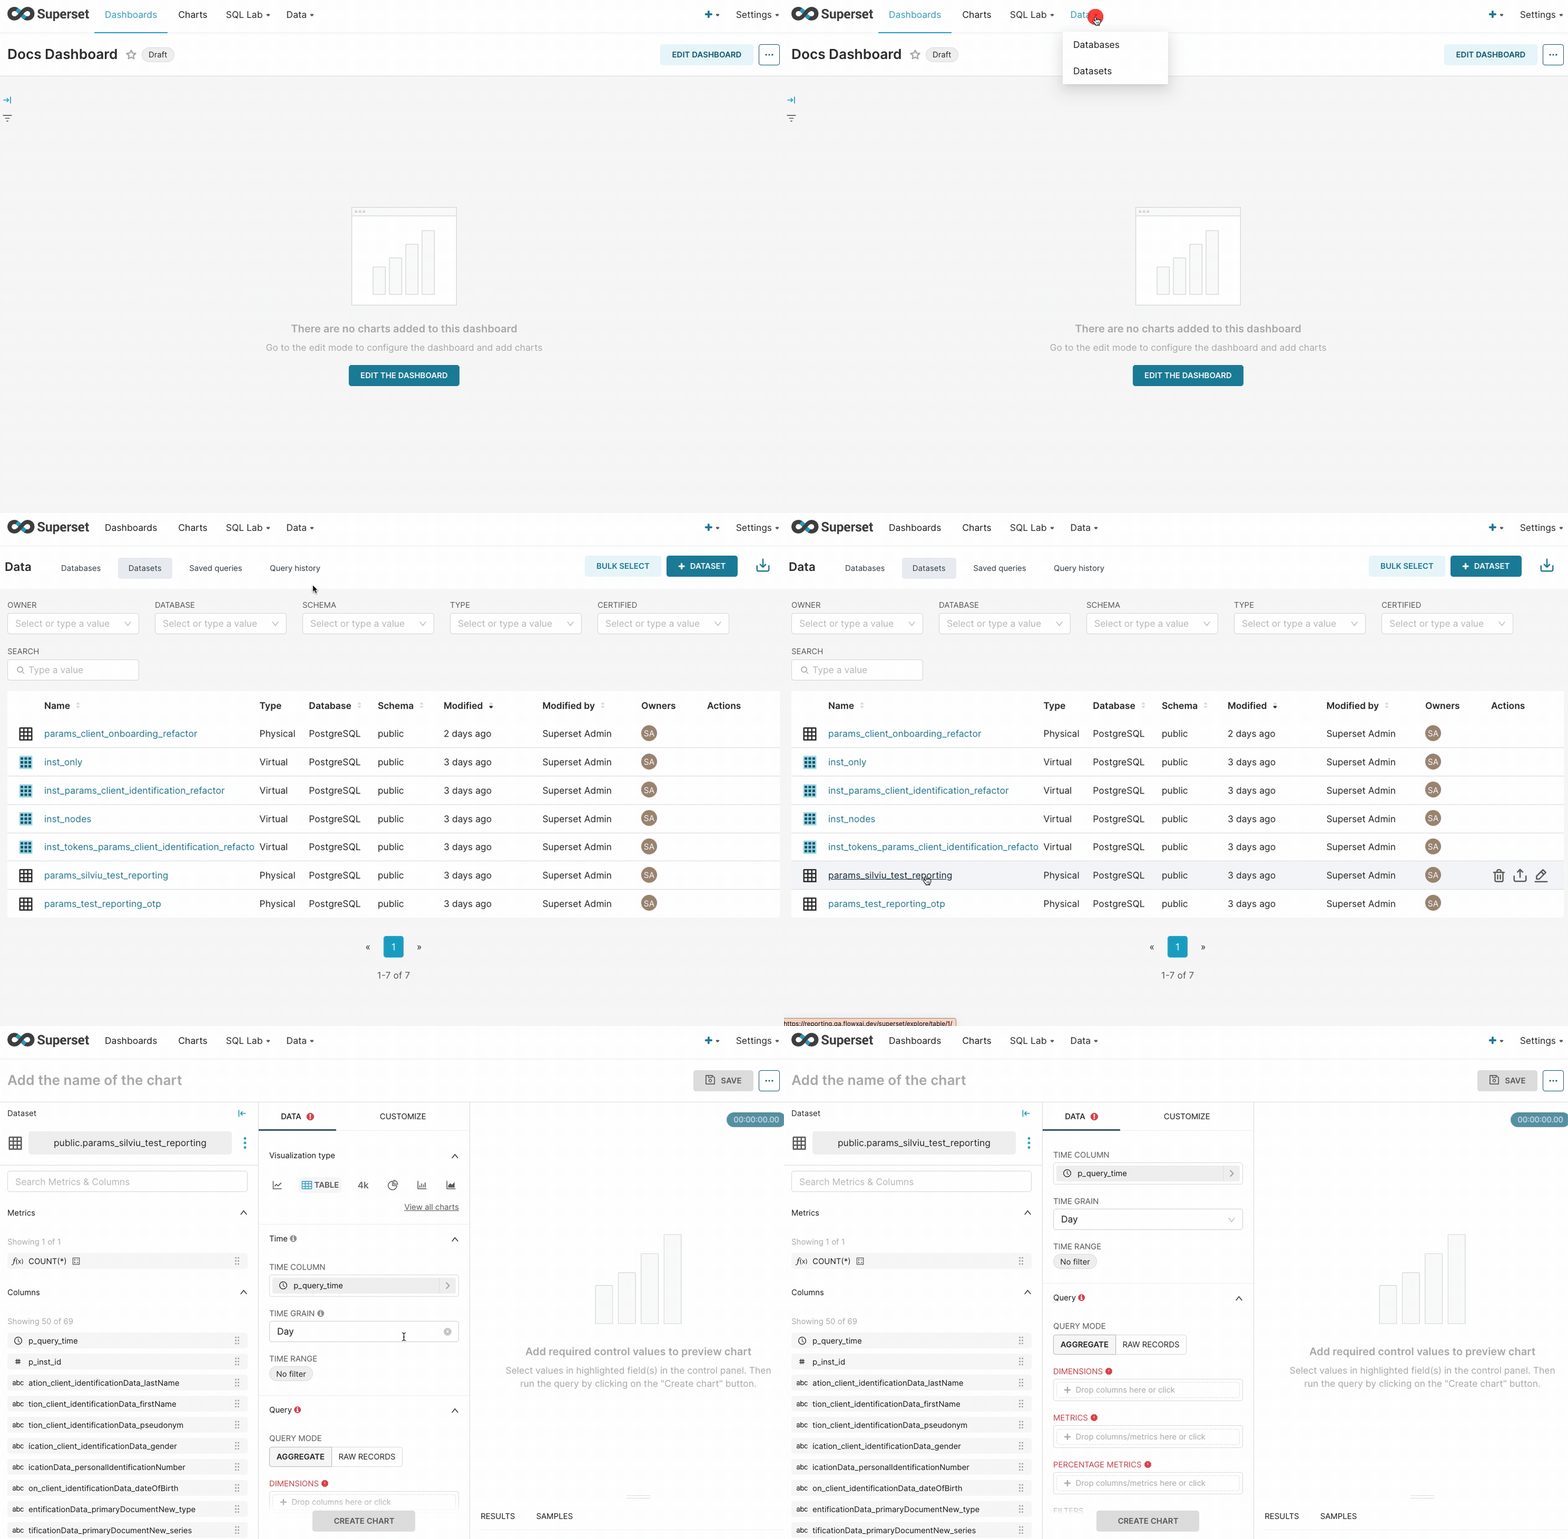
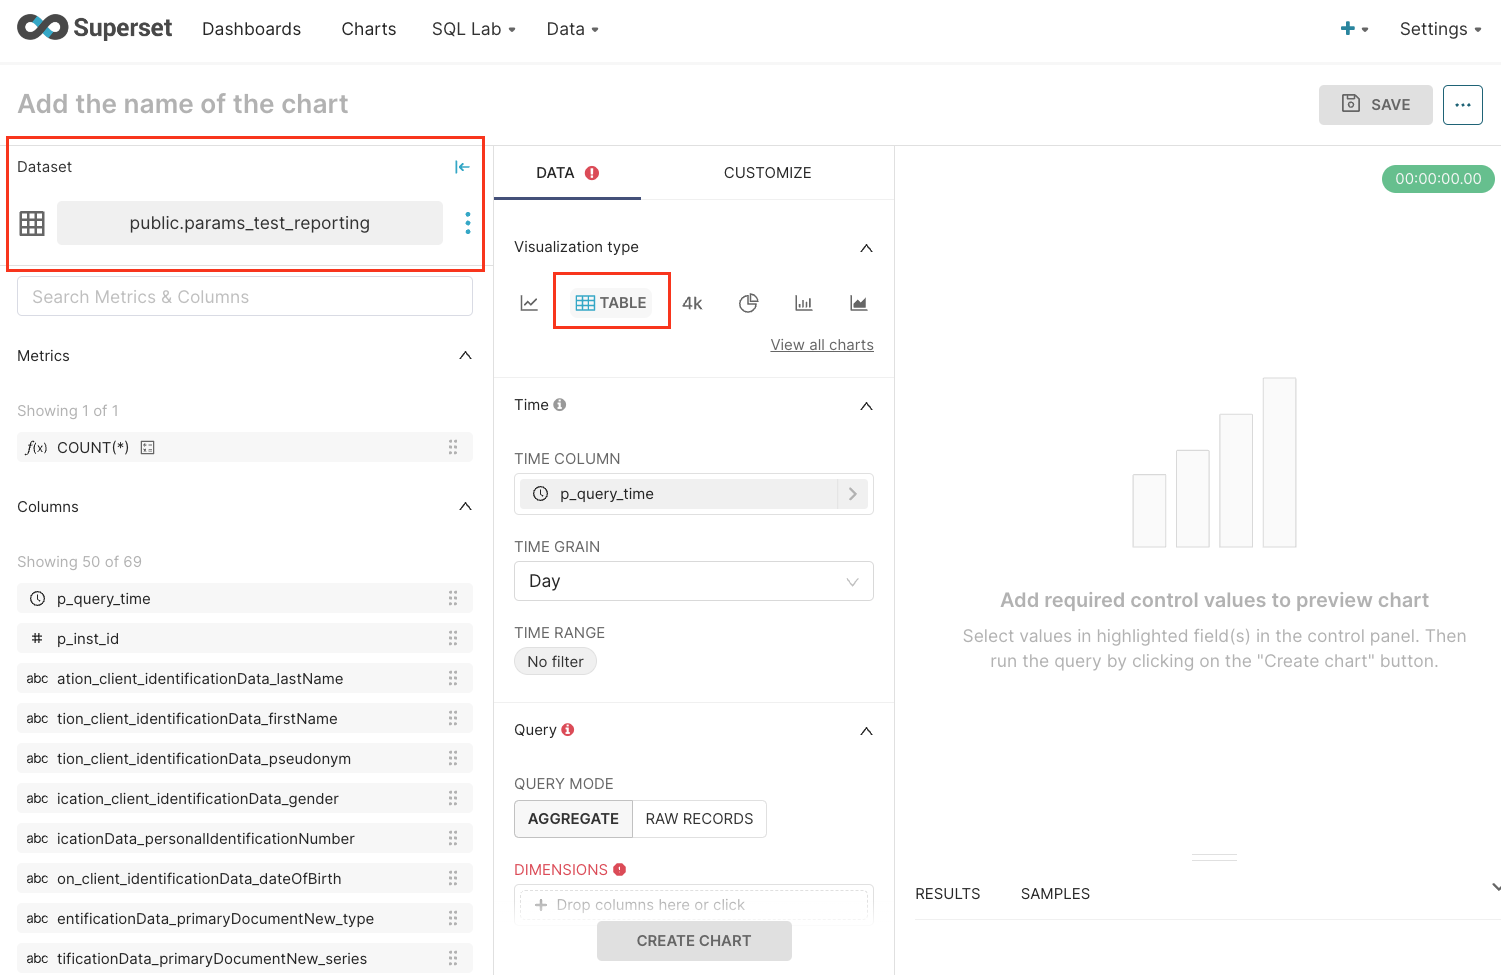
- When you select a dataset, by default table visualization type is selected.
To view all the existent visualization types, click View all charts, the charts’ gallery will open.
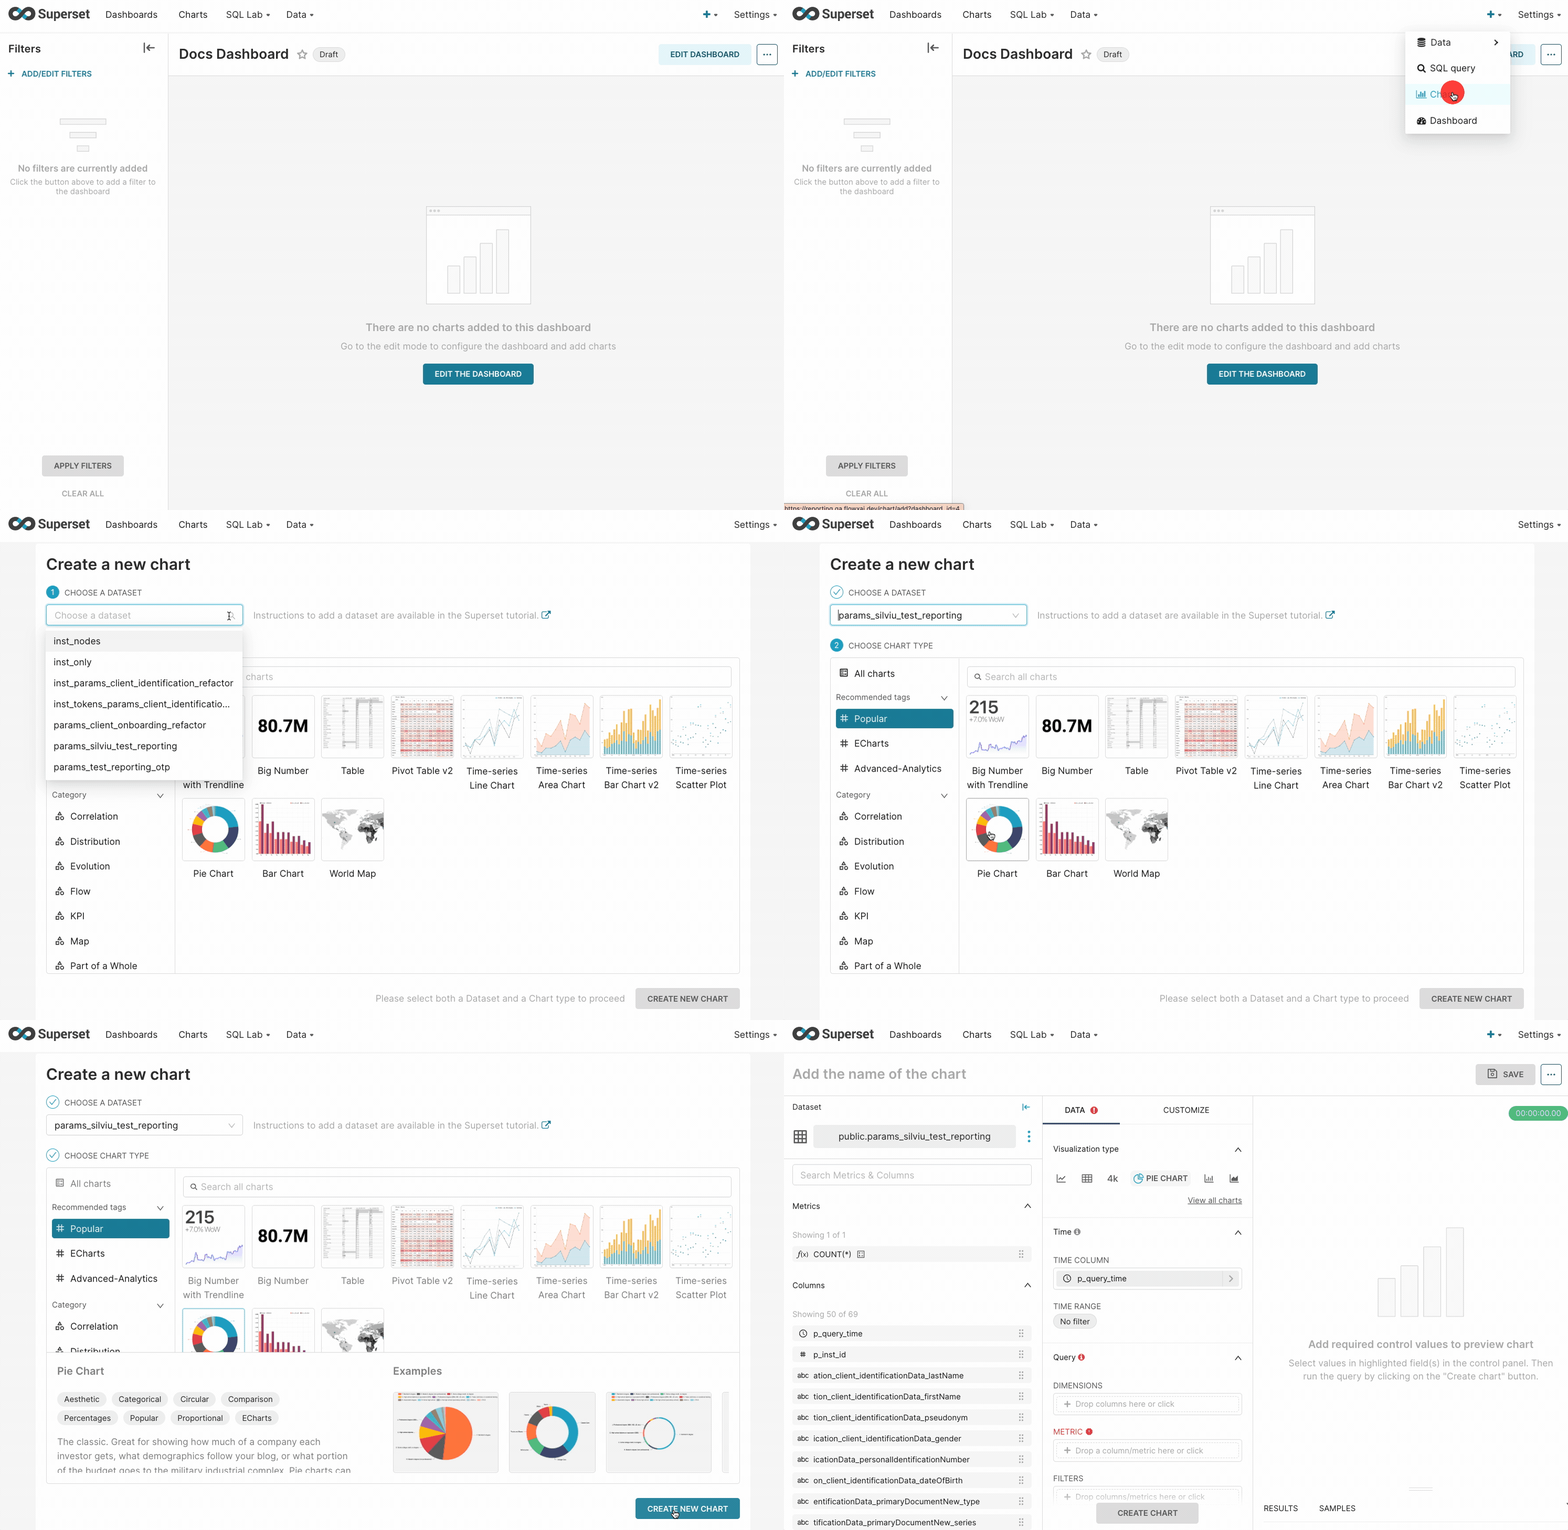
Creating charts using Chart gallery
Using the Chart gallery is a useful method when you are not quite sure about which chart will be best for you. To create a Chart using the second method, you must follow the next steps:- Select the ”+” icon from the top toolbar and choose Chart.
- Choose the dataset and chart type.
- Review the description and example graphics of the selected chart, then click Create new chart.
Configuring a Chart
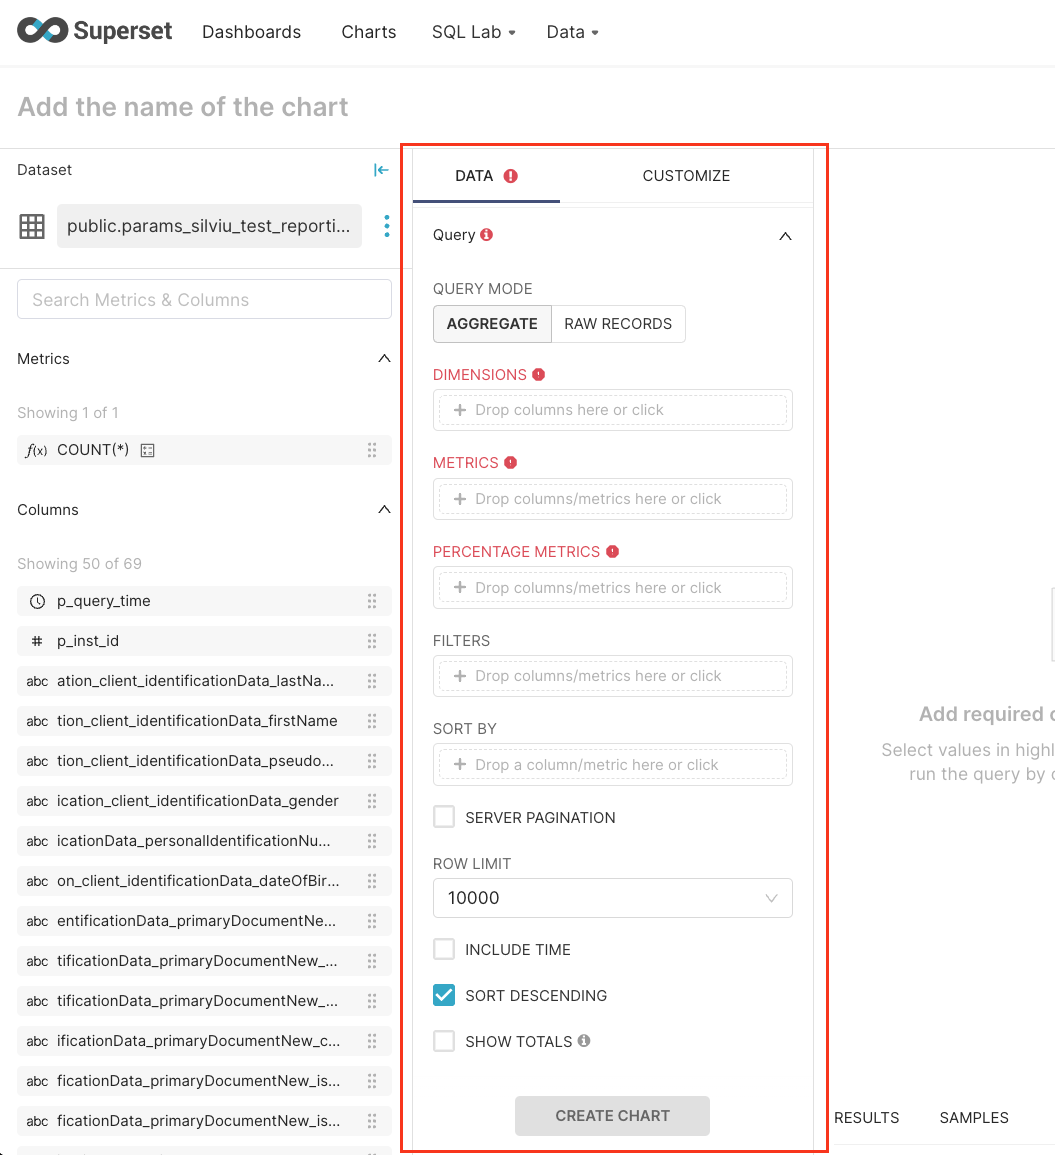
Configure the Query fields by dragging and dropping relevant columns to the matching fields. Note that time and query form attributes vary by chart type.Exporting/importing a Chart
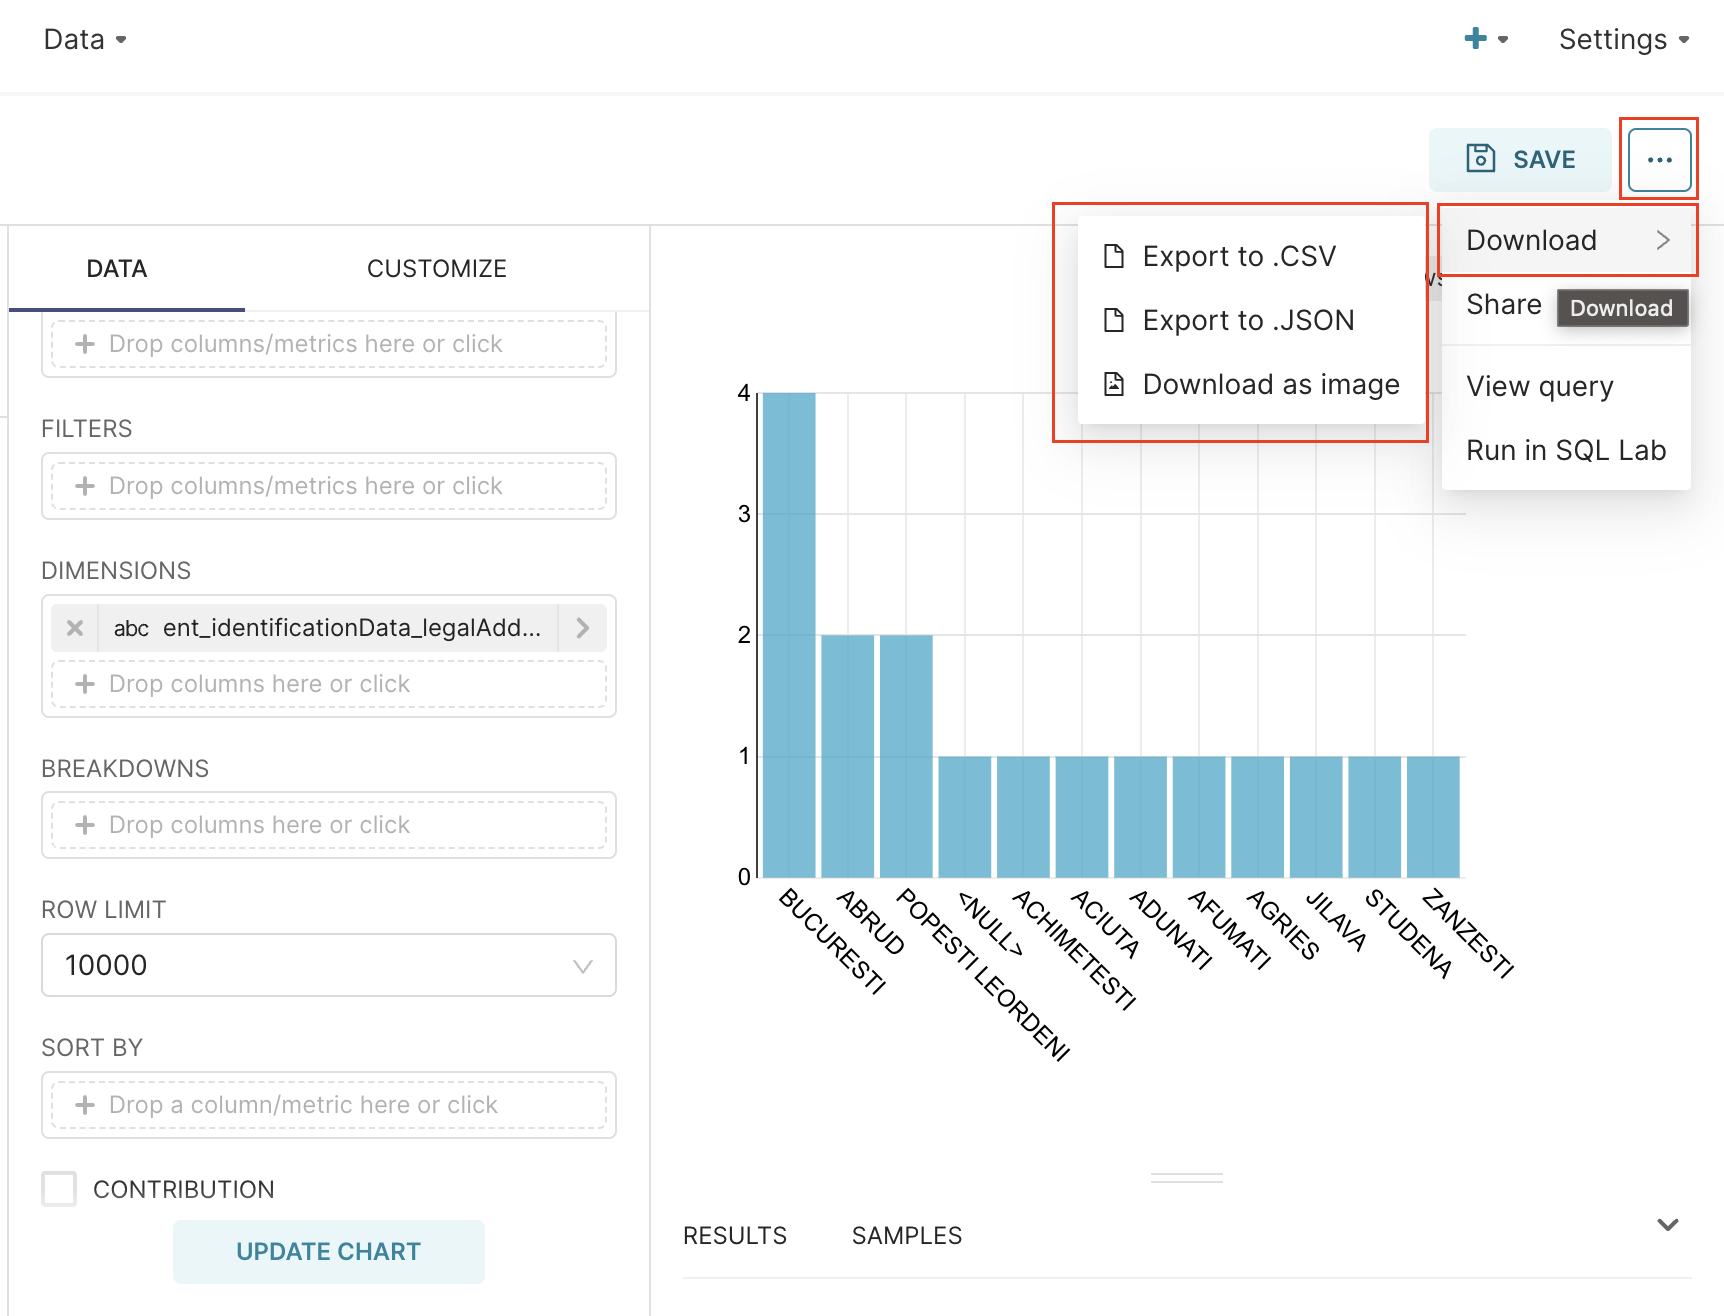
You can export and import charts to help you analyze your data and manipulate dashboards. To export/import a chart, follow the next steps:- Open Superset and navigate to Charts from the top navigation bar.
- Select the desired chart and click the breadcrumbs menu in the top-right corner.
- Choose an export option: .CSV, .JSON, or Download as image.
- Time - time related form attributes
- Query - query attributes
- Dimensions - one or many columns to group by
- Metrics - metrics to display
- Percentage metrics - metrics for which percentage of total are to be displayed, calculated from only data within the row limit
- Filters - metric used for filtering
- Sort by - metric used to define how the top series are sorted if a series or row limit is present
- Row limit - limits the number of rows that get displayed
Creating a dashboard
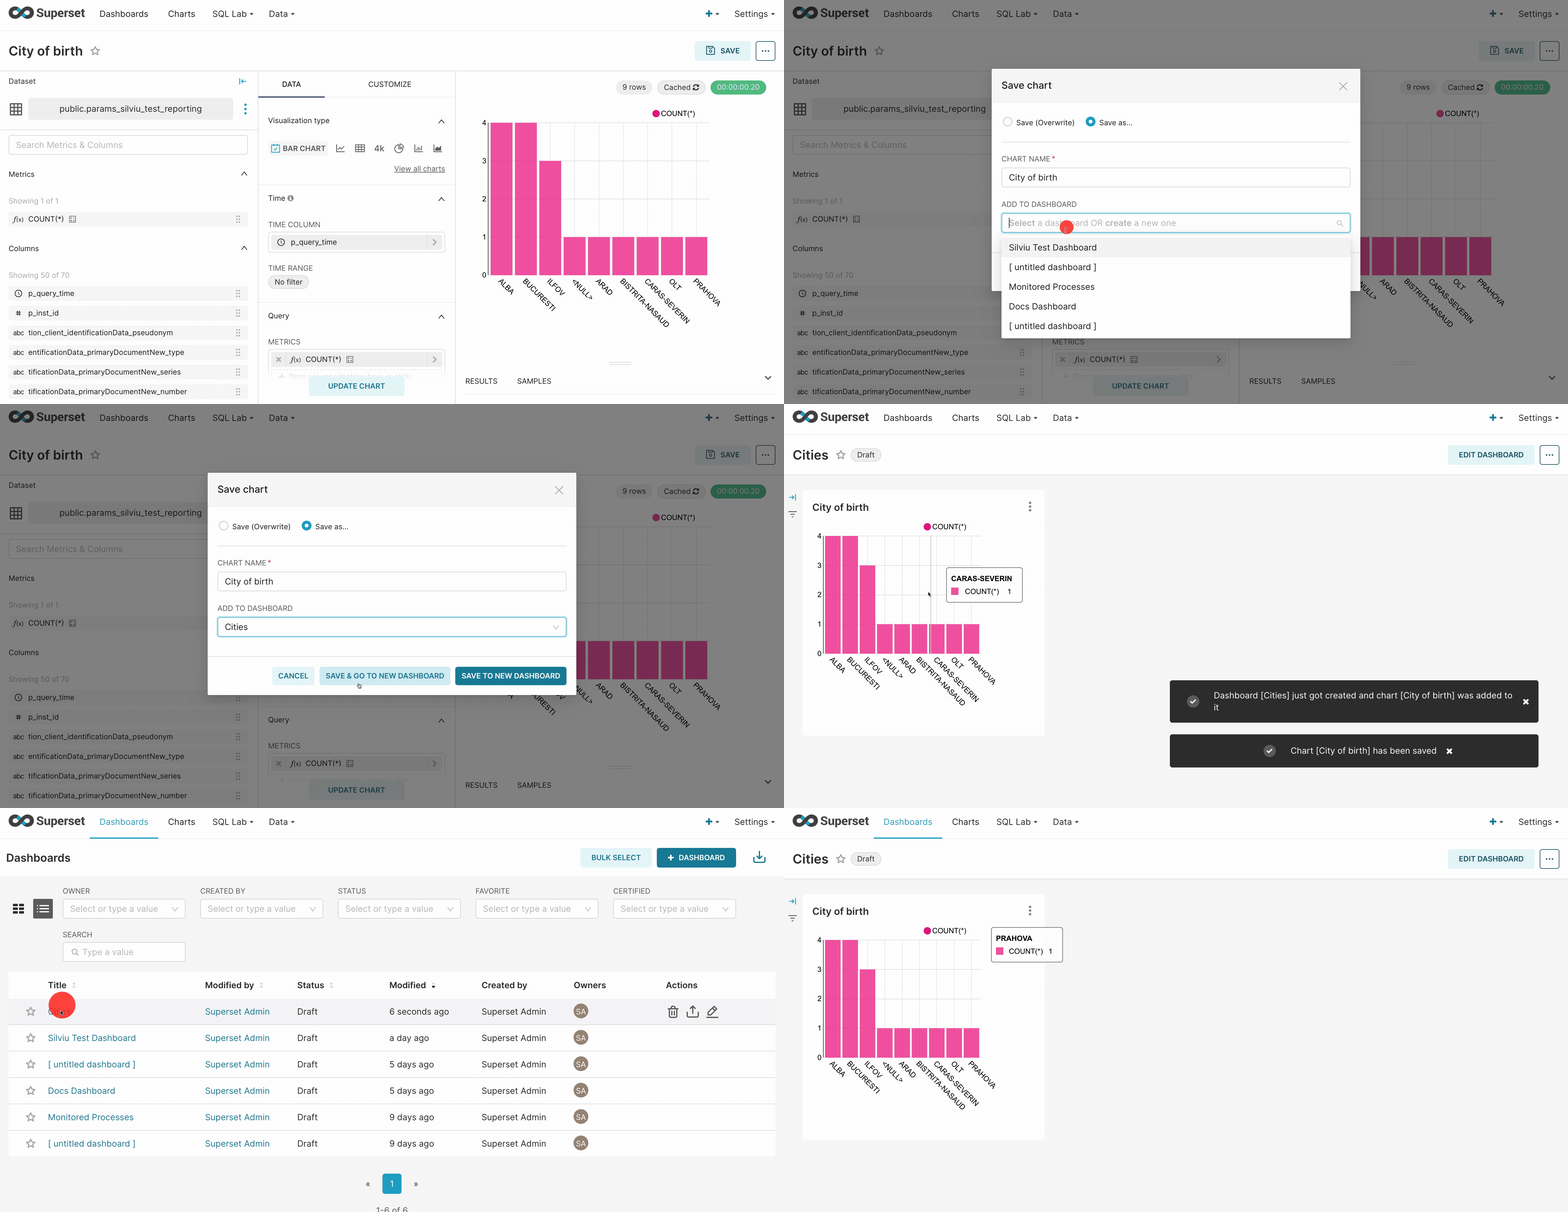
To create a dashboard follow the next steps:- Create a new chart and save it to a new dashboard.
- To publish, click Save and go to Dashboard.