

Overview
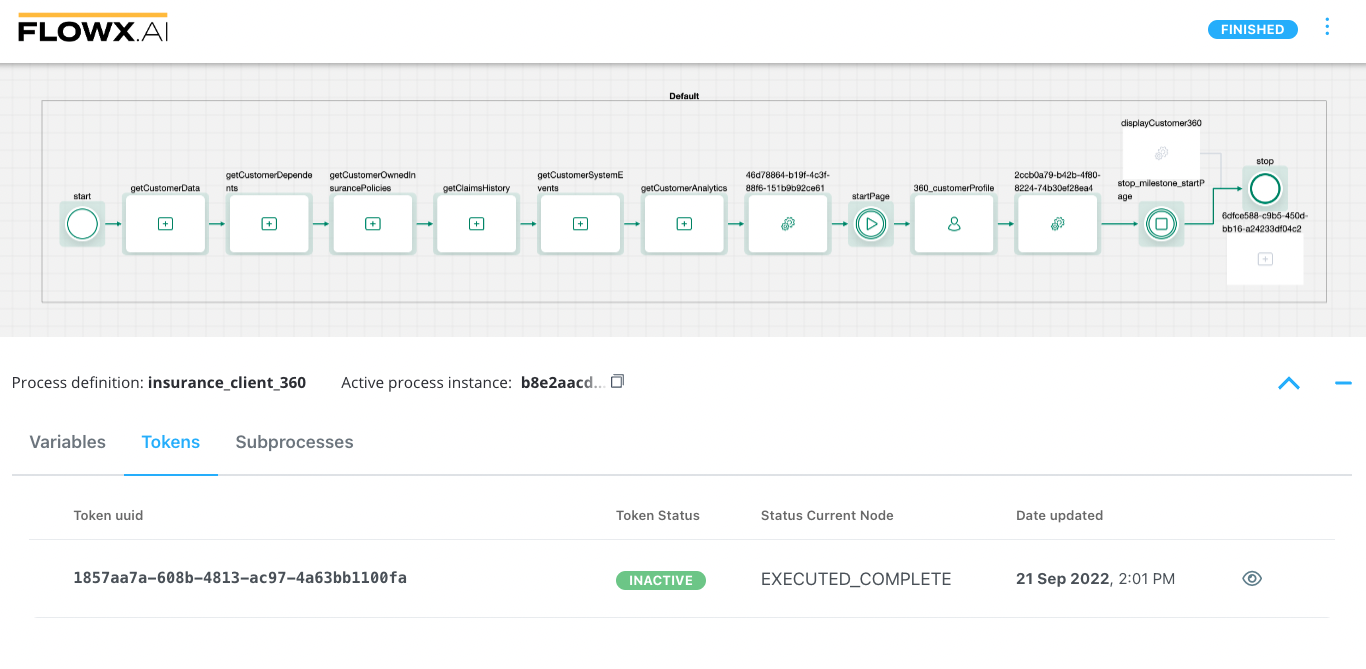
Once the desired processes are defined in the platform, they are ready to be used. Each time a process needs to be used, for example each time a customer wants to request, for example, a new credit card, a new instance of the specified process definition is started in the platform. Think of the process definition as a blueprint for a house, and of the process instance as each house of that type being built. The FlowX Engine is responsible for executing the steps in the process definition and handling all the business logic. The token represents the current position in the process and moves from one node to the next based on the sequences and rules defined in the exclusive gateways. In the case of parallel gateways, child tokens are created and eventually merged back into the parent token. Kafka events are used for communication between FLOWX.AI components such as the engine and integrations/plugins. Each event type is associated with a Kafka topic to track and orchestrate the messages sent on Kafka. The engine updates the UI by sending messages through sockets.More about Kafka
Checking the Process Status
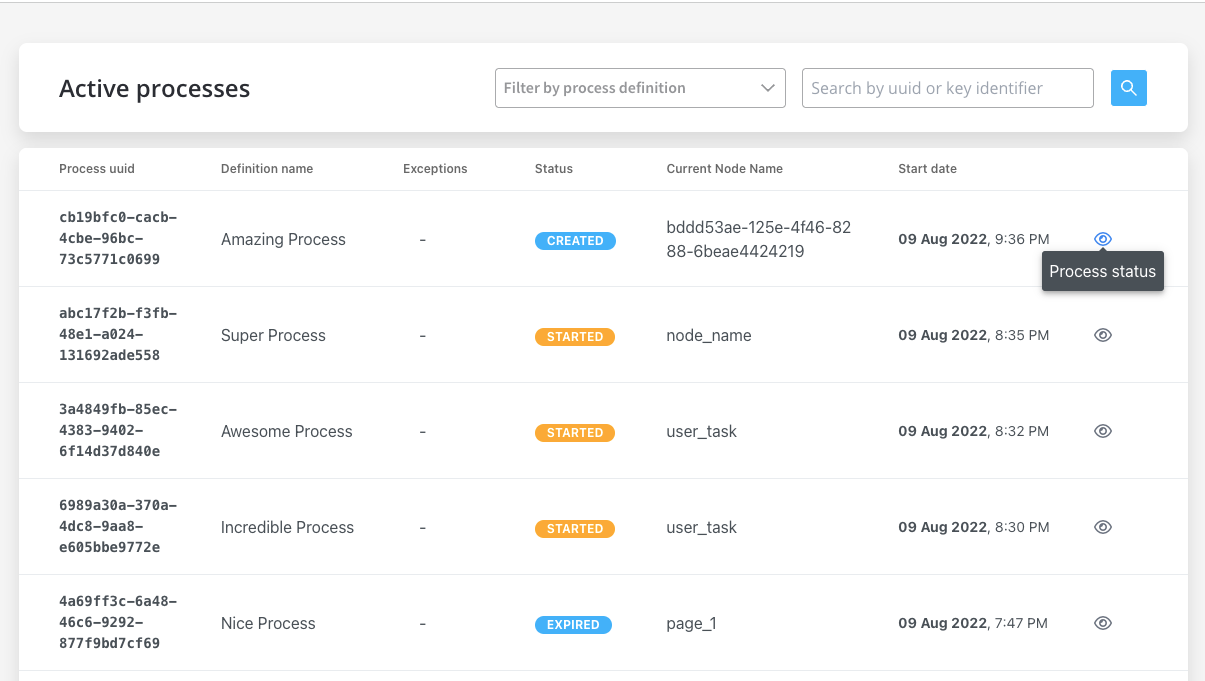
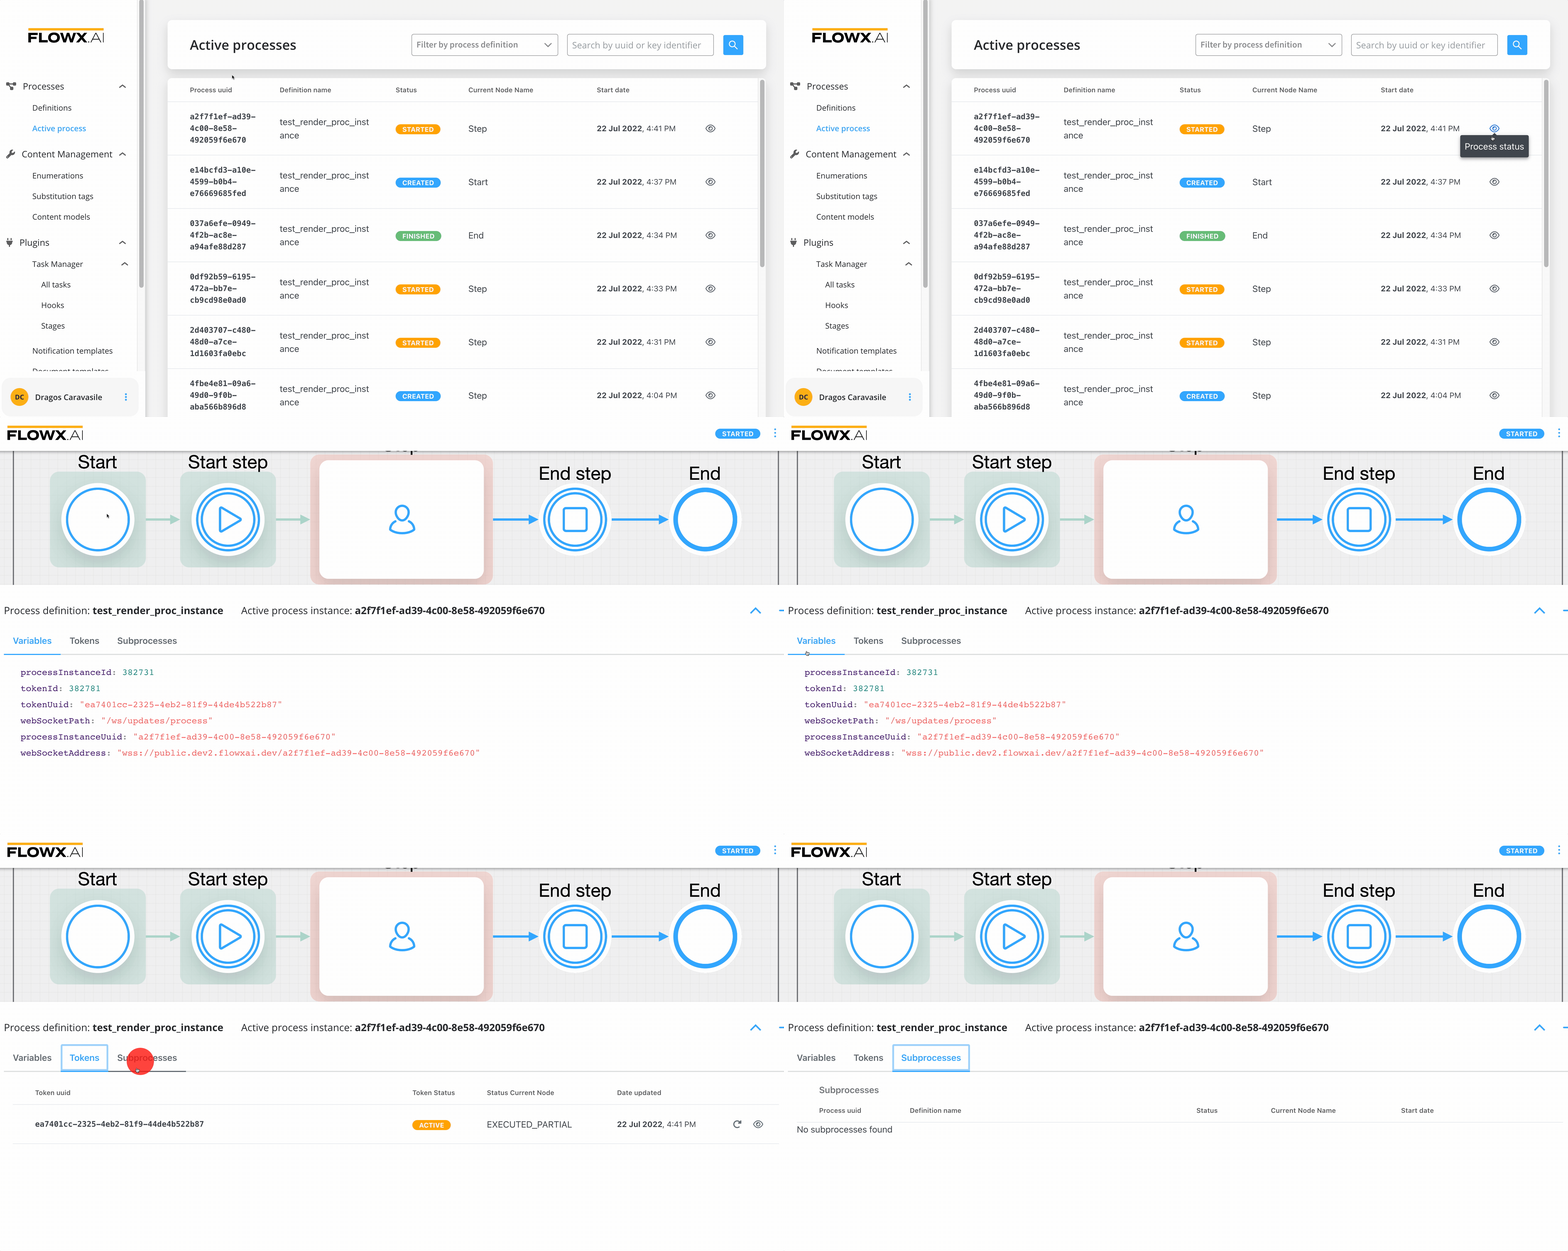
To check the status of a process or troubleshoot a failed process, follow these steps:- Open FLOWX Designer.
- Go to Processes → Active Process → Process instances.
- Click Process status button.
Understanding the Process Status Data
Understanding the various elements within process status data is crucial. Here’s what each component entails: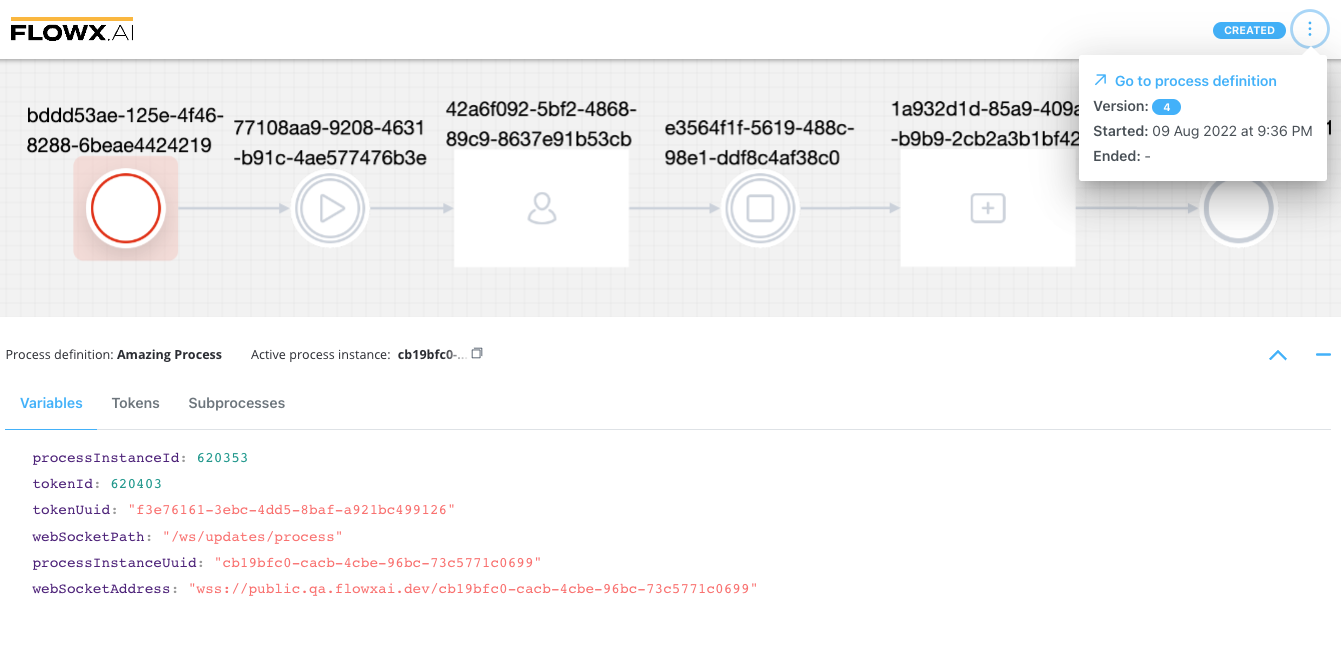
- The Status field indicates the state of the process instance, offering distinct values:
- Active process instance - the UUID of the process instance, with a copy action available
- Variables - displayed as an expanded JSON
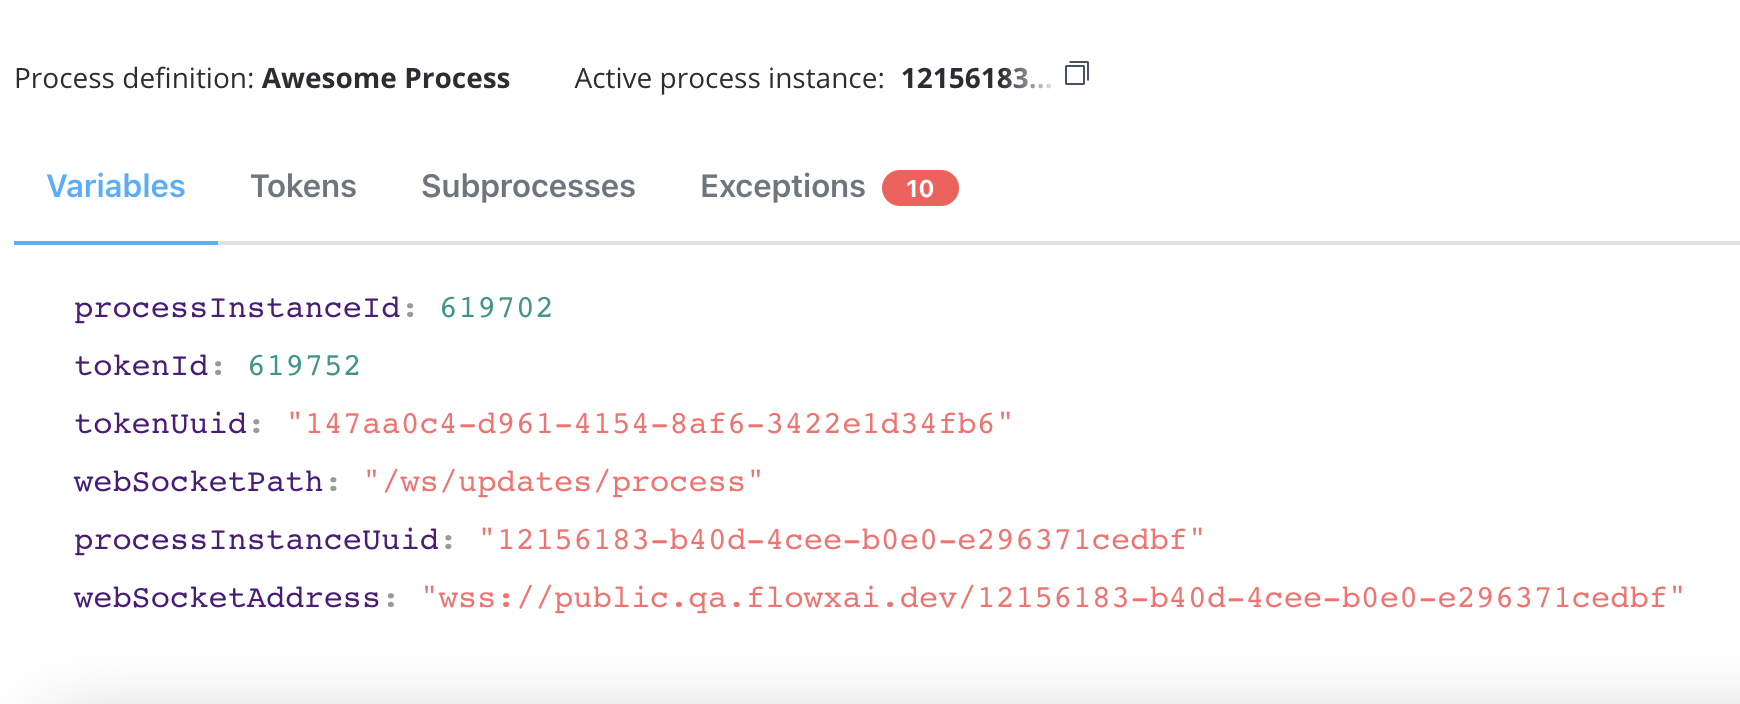
- Tokens - a token represents the state within the process instance and describe the current position in the process flow
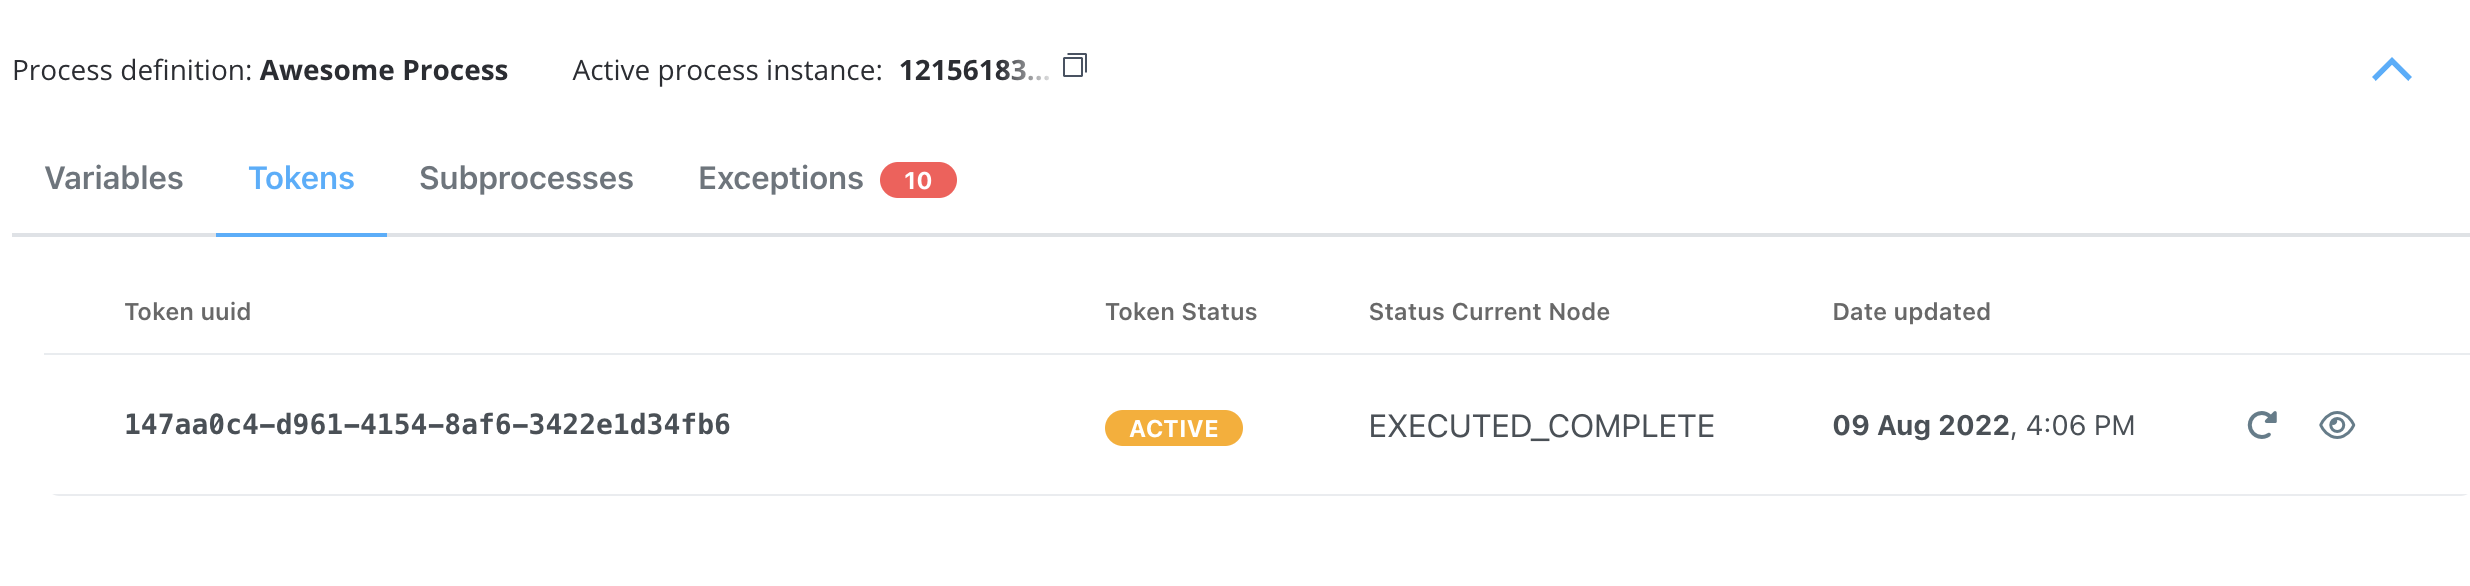
For more information about token status details, here.
- Subprocesses - displayed only if the current process instance generated a subprocess instance
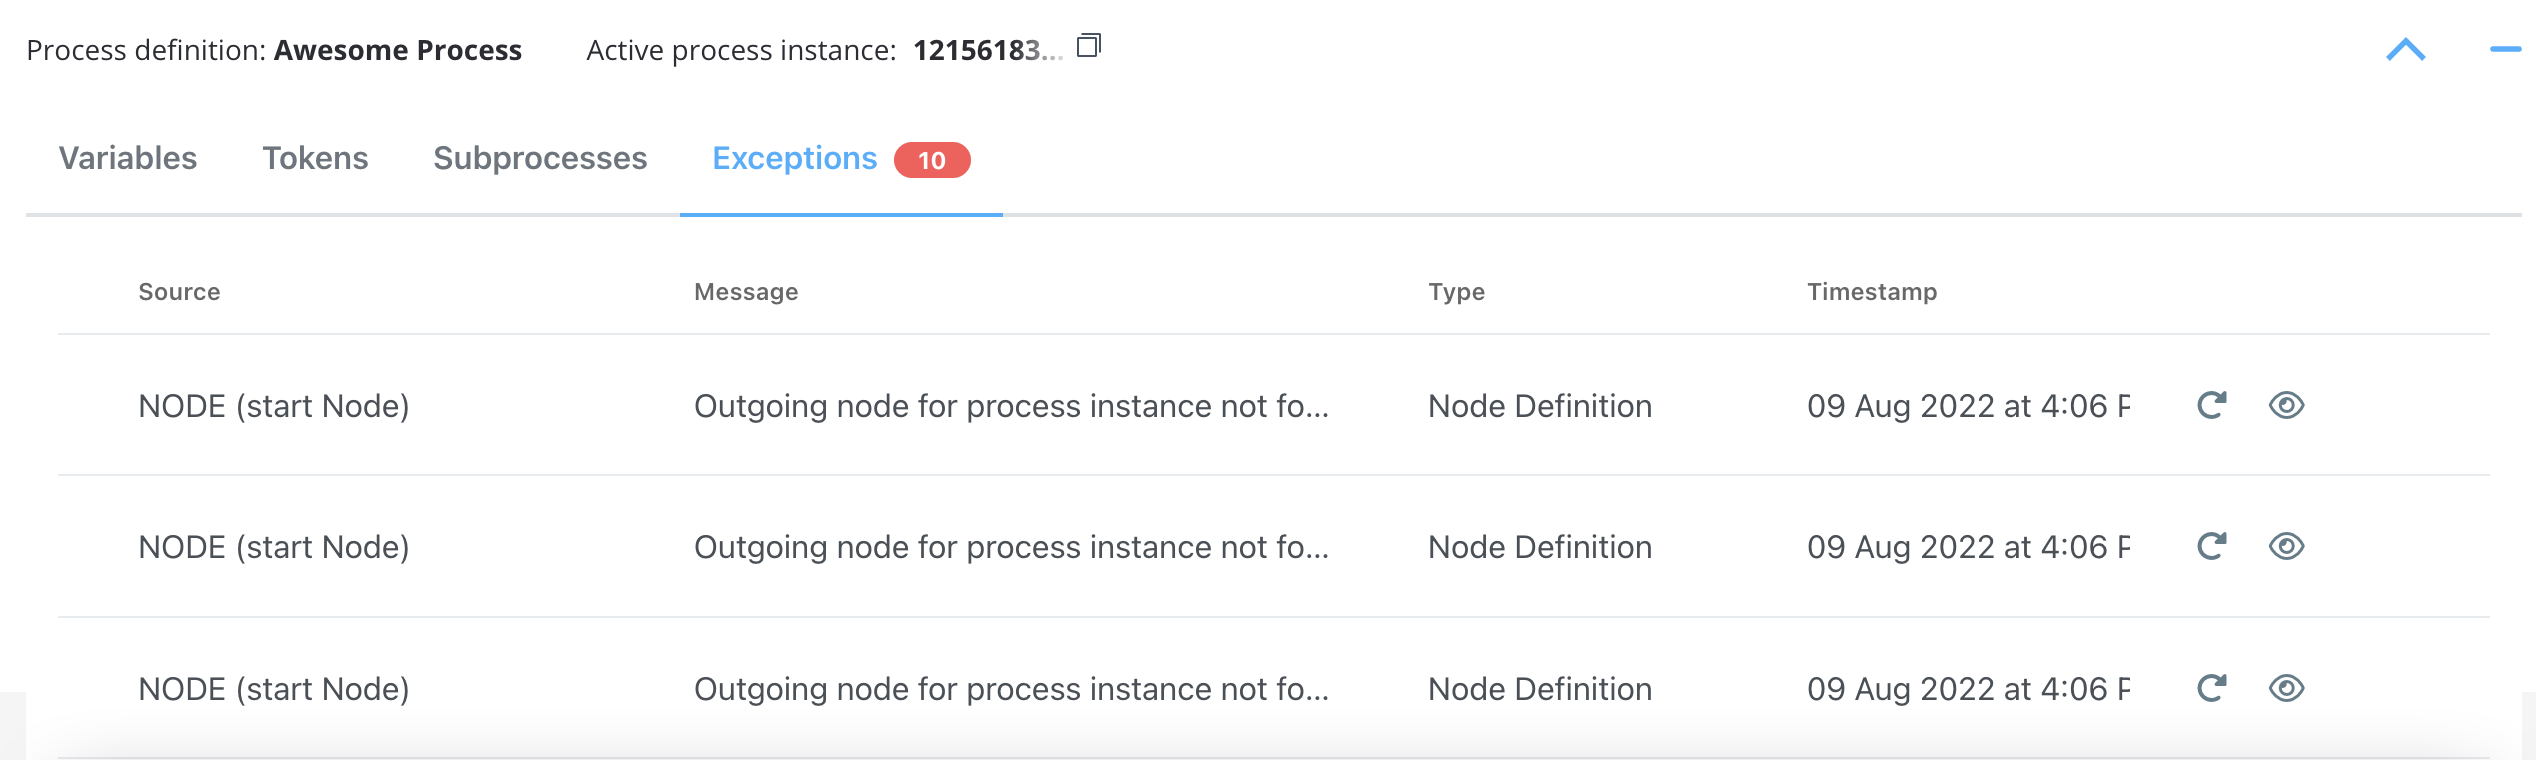
- Exceptions - errors that let you know where the process is blocked, with a direct link to the node where the process is breaking for easy editing
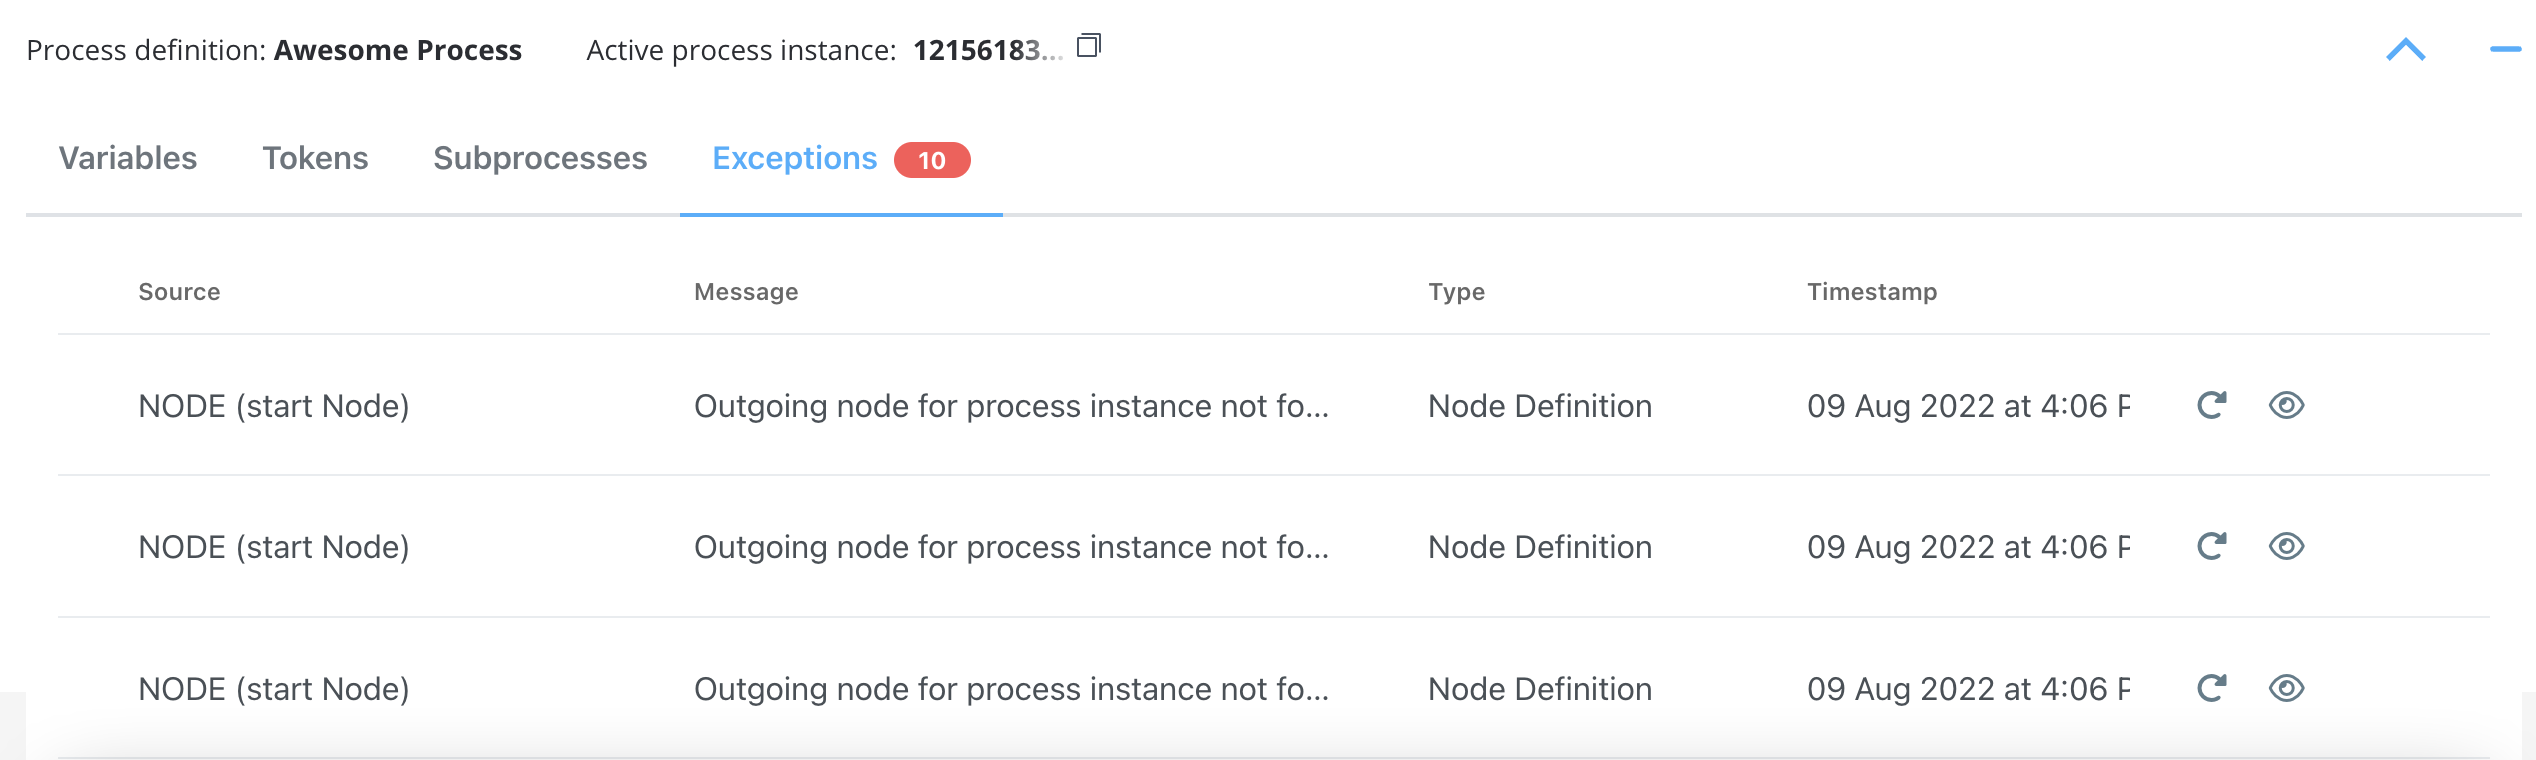
For more information on token status details and exceptions, check the following section:
- Audit Log - the audit log displays events registered for process instances, tokens, tasks, and exceptions in reverse chronological order by timestamp
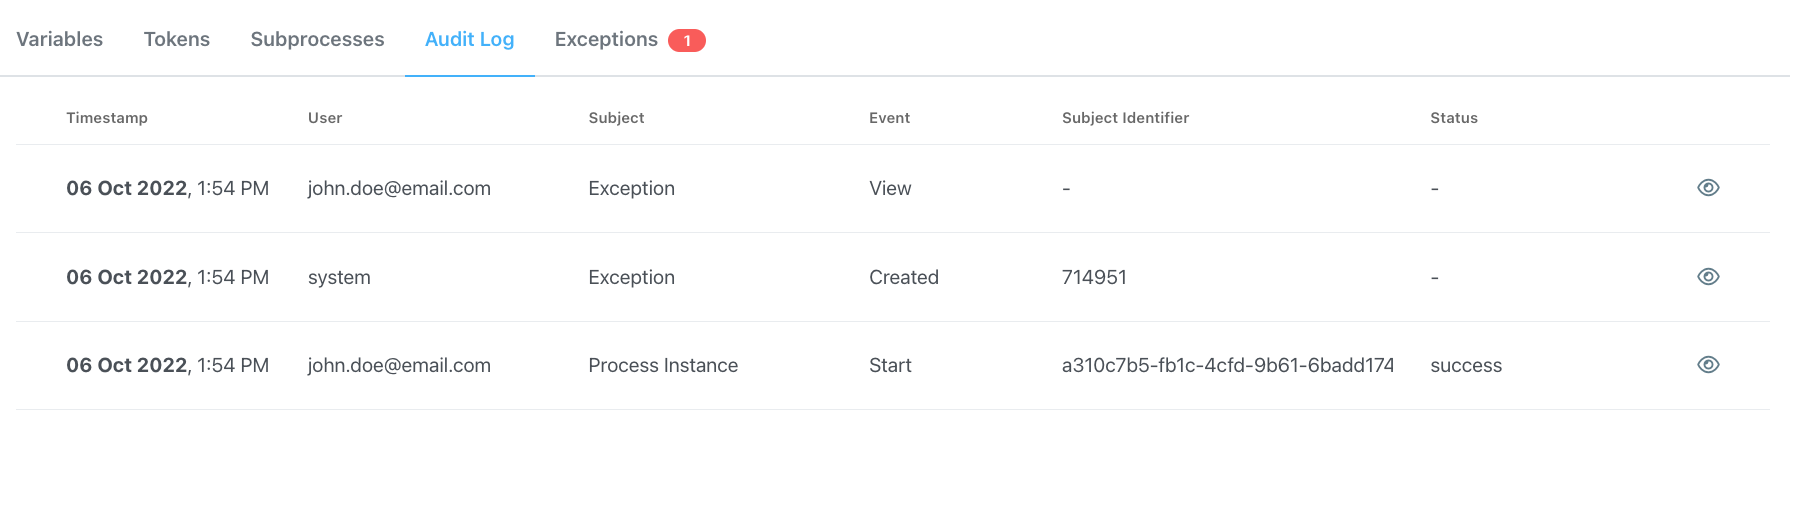
Audit
Process menu
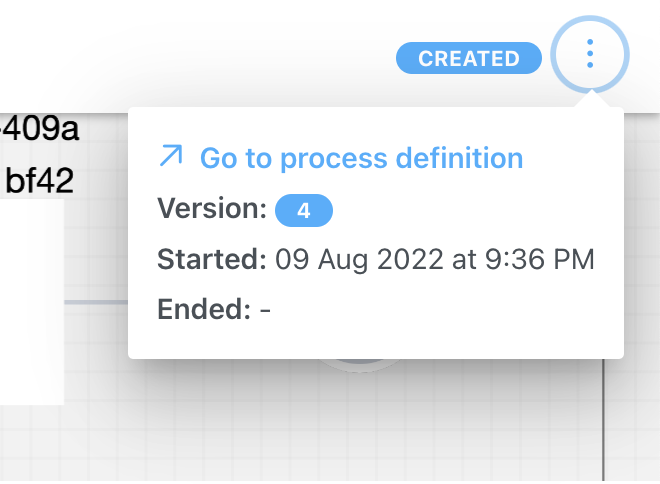
In the breadcrumb menu (top-right corner), you can access the following:- Go to process definition - opens the process for editing
- Version - version of the process definition
- Started - timestamp for when the process instance started
- Ended - timestamp for when the process instance ended
Color coding
In the Process Status view, some nodes are highlighted with different colors to easily identify any failures:- Green - nodes highlighted with green mark the nodes passed by the token
- Red - the node highlighted with red marks the node where the token is stuck (process failure)
Starting a new process instance
To start a new process instance, a request must be made to the FlowX Engine. This is handled by the web/mobile application. The current user must have the appropriate role/permission to start a new process instance.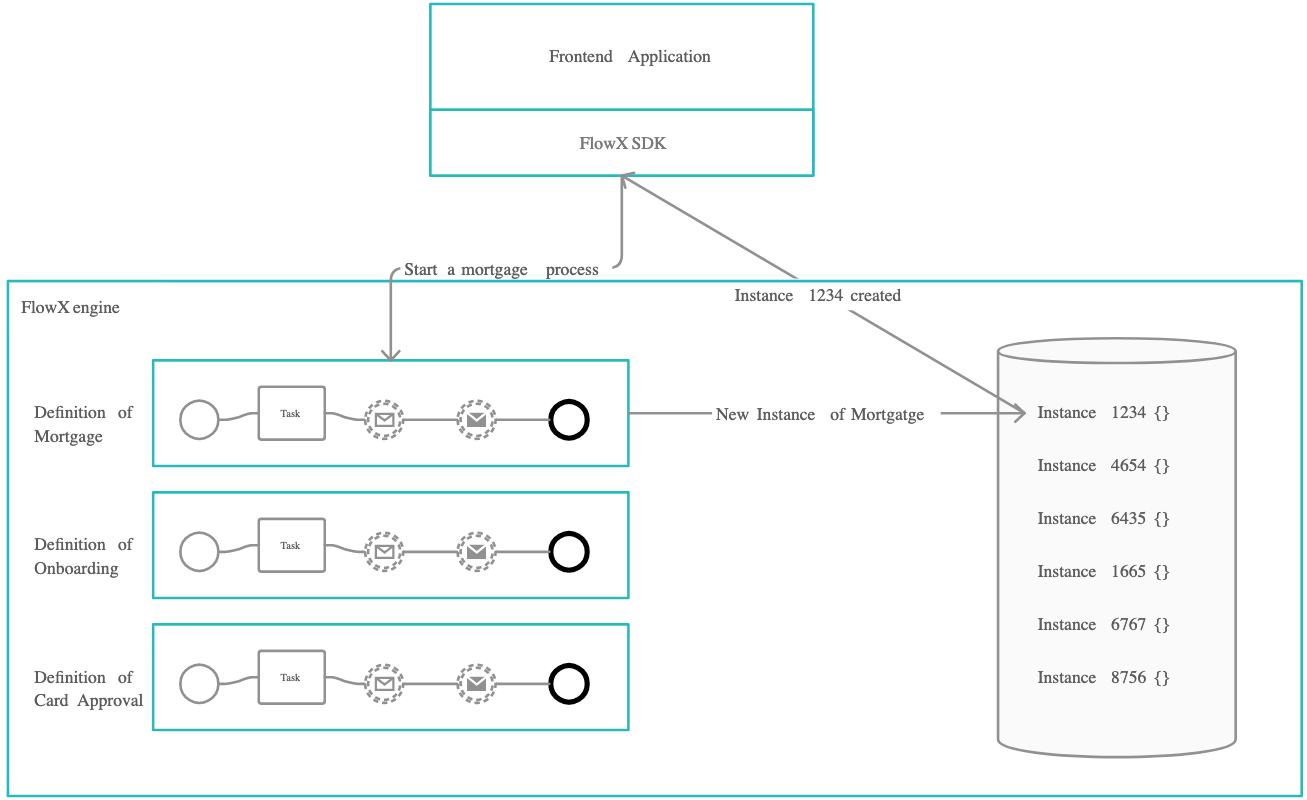 To be able to start a new process instance, the current user needs to have the appropriate role/permissions:
Configuring access roles for processes
Troubleshooting possible errors
If everything is configured correctly, the new process instance should be visible in the UI and added to the database. However, if you encounter issues, here are some common error messages and their possible solutions: Possible errors include:Exceptions
Exceptions are types of errors meant to help you debug a failure in the execution of a process.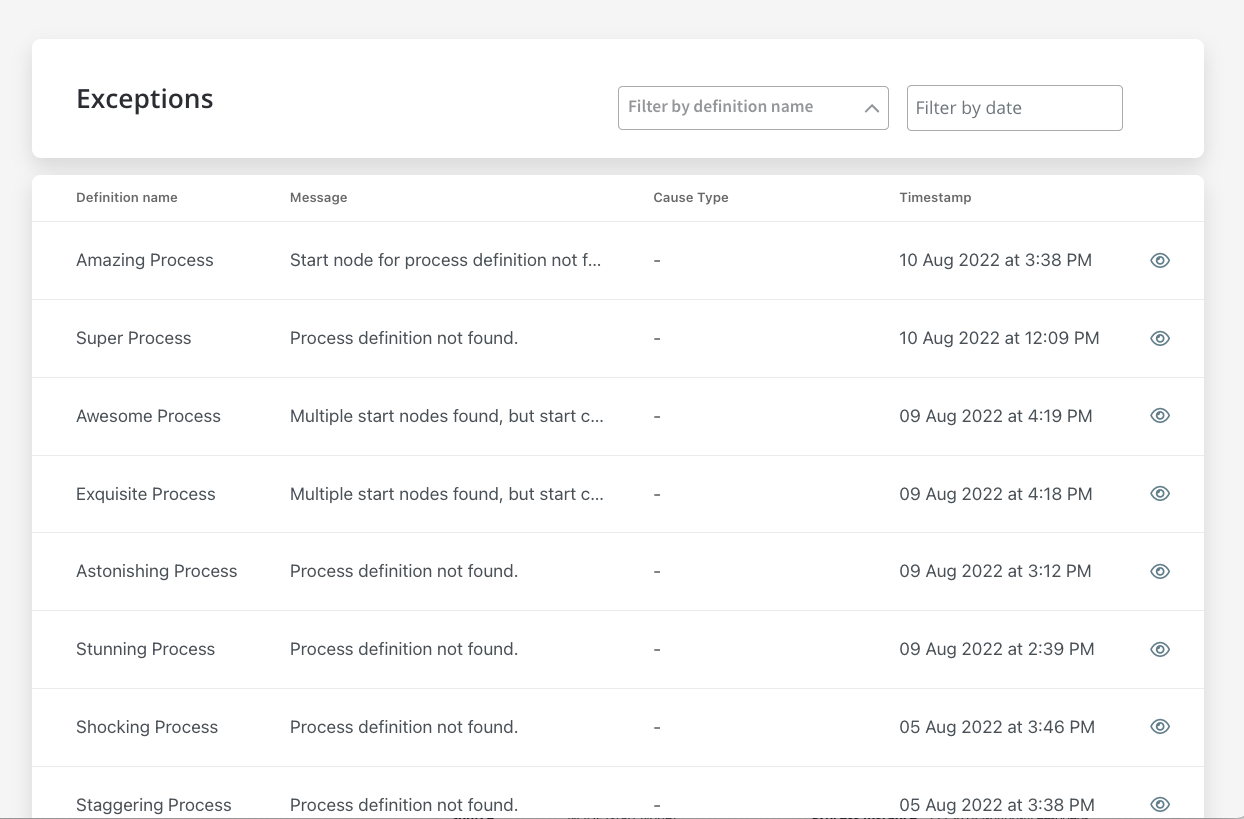 Exceptions can be accessed from multiple places:
- Failed process start tab from Active process menu in FLOWX Designer
- Process Status view, accessible from Process instances list in FLOWX Designer
 :::caution
If you open a process instance and it does not contain exceptions, the Exceptions tab will not be displayed.
:::
:::caution
If you open a process instance and it does not contain exceptions, the Exceptions tab will not be displayed.
:::
Exceptions data
When you click view button, a detailed exception will be displayed.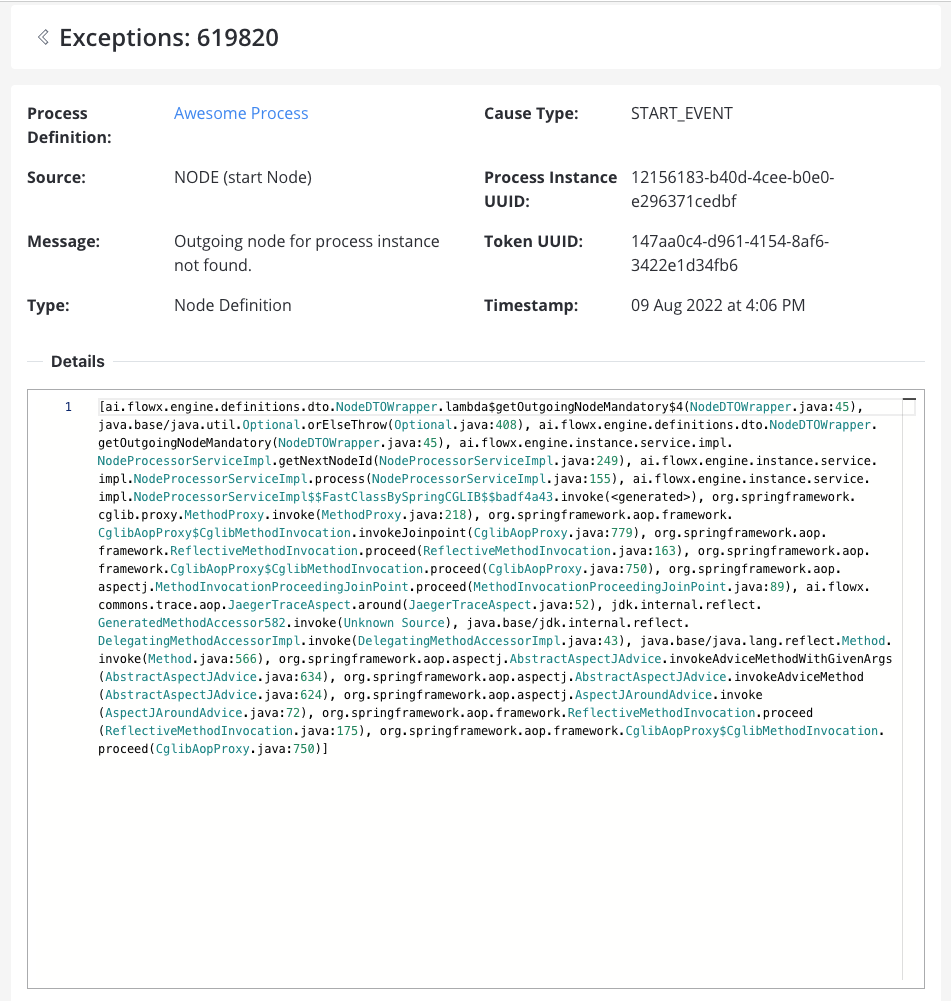
- Process Definition - the process where the exception was thrown
- Source - the source of the exception (see the possible type of sources below)
- Message - a hint type of message to help you understand what’s wrong with your process
- Type - exception type
- Cause Type - cause type (or the name of the node)
- Process Instance UUID - process instance unique identifier
- Token UUID - token unique identifier
- Timestamp - default format:
yyyy-MM-dd'T'HH:mm:ss.SSSZ - Details - stack trace (a stack trace is a list of the method calls that the process was in the middle of when an Exception was thrown)