> ## Documentation Index
> Fetch the complete documentation index at: https://docs.flowx.ai/llms.txt
> Use this file to discover all available pages before exploring further.
# Reporting overview
> Reporting plugin will help you to build and bootstrap custom reports built on generic information about usage and processes using reporting plugin. Multiple reports to meet various needs can be generated.
The plugin uses **Superset** as a data exploration and visualization tool.
[Superset Docker](https://hub.docker.com/r/apache/superset)
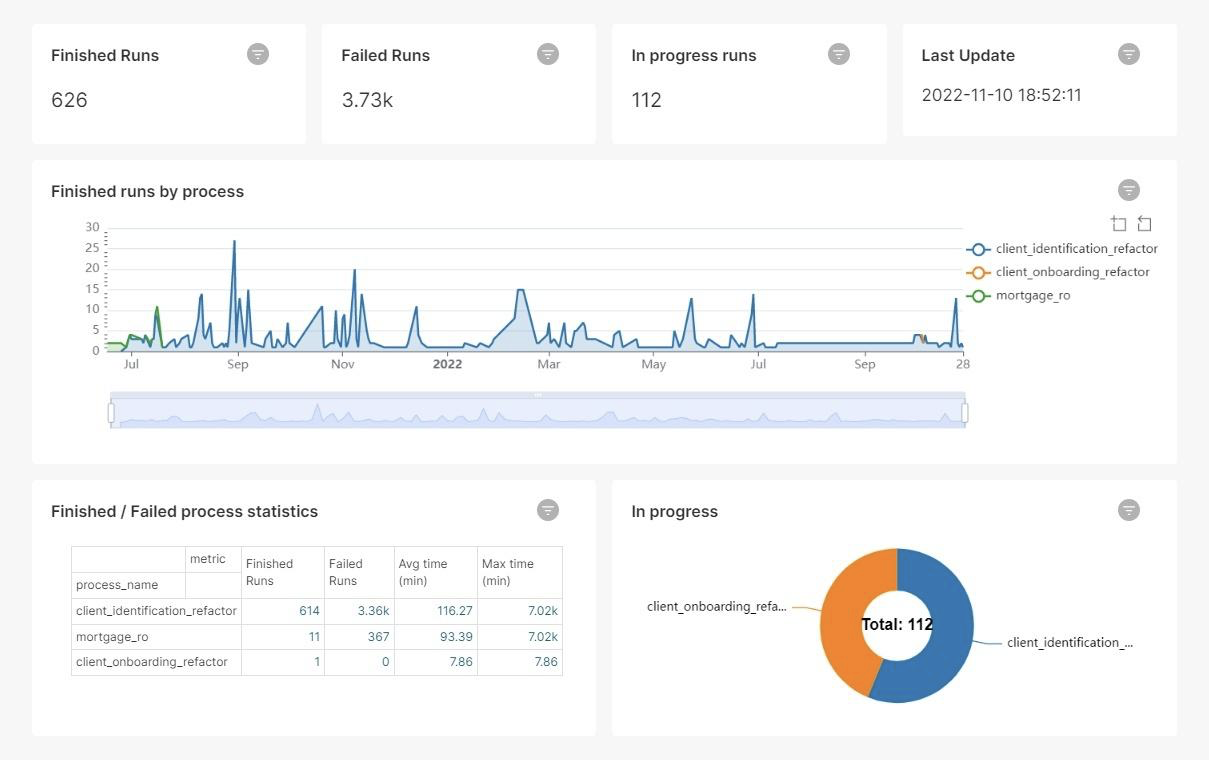
## Architecture
Below you can find the architecture of the reporting plugin.

## What is Superset?
Apache Superset is an open-source software application for data exploration and data visualization able to handle data at a large scale. It enables users to connect their company's databases and perform data analysis, and easily build charts and assemble dashboards.
Superset is also an SQL IDE, so users can write SQL, join data create datasets and so on.
[Superset documentation](https://superset.apache.org/docs/intro/)
## Superset elements
### Data sources
The **Data** tab represents the sources of all information:
* Databases
* CSV files
* Tables
* Excel files
#### Databases (PostgreSQL)
Reporting plugin can be used with Superset by connecting it with a PostgreSQL DB.
### Charts
Charts represent the output of the information. There are multiple visualization charts/ plugins available.
### Dashboards
With the use of dashboards, you can share persuading flows, show how metrics change in various scenarios and match your company efforts with logical, evidence‐based visual indicators.
### Datasets
Contains all the information for extracting and processing data from the DB, including SQL queries, calculated metrics information, cache settings, etc. Datasets can also be exported / imported.
## Connecting to a database
It is mandatory that before using Superset, the reporting plugin need to have a PostgreSQL database installed and configured.
[FlowX Engine DB configuration](../../../../../setup-guides/flowx-engine-setup-guide/engine-setup)
[Reporting DB configuration](../../../../../setup-guides/plugins-setup-guide/reporting-setup)
Read-only users should be used in production in the reporting-plugin cronjob.
### Connecting Superset to a DB
To connect Superset to a database, follow the next steps:
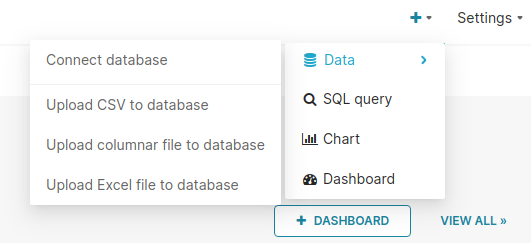
1. From the Toolbar, hover your cursor over the **"+"** icon, then select **Data**, and then select **Connect Database**.
2. The **Connect a database** window appears. Select the appropriate **database card** (in this case - PostgreSQL).
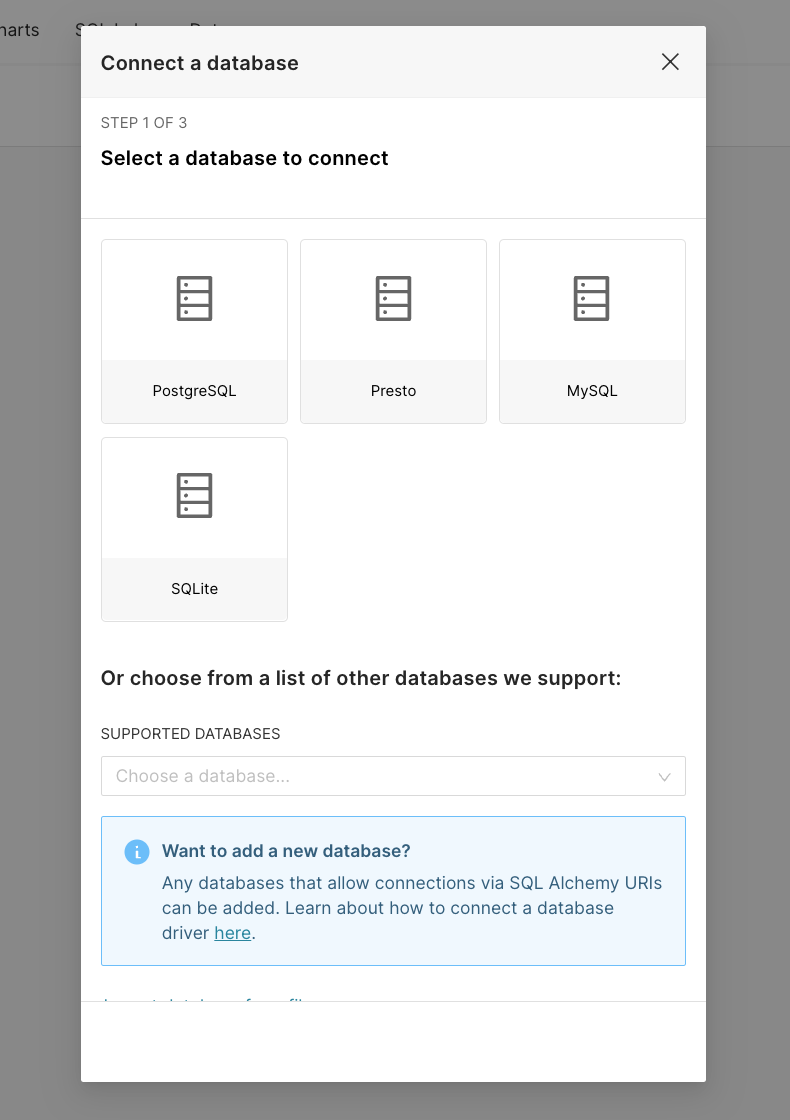
3. After you selected the DB, click **Connect this database with a SQLAlchemy URI string instead?**.
4. Fill in the **SQLALCHEMY URI** and then click **Connect**.
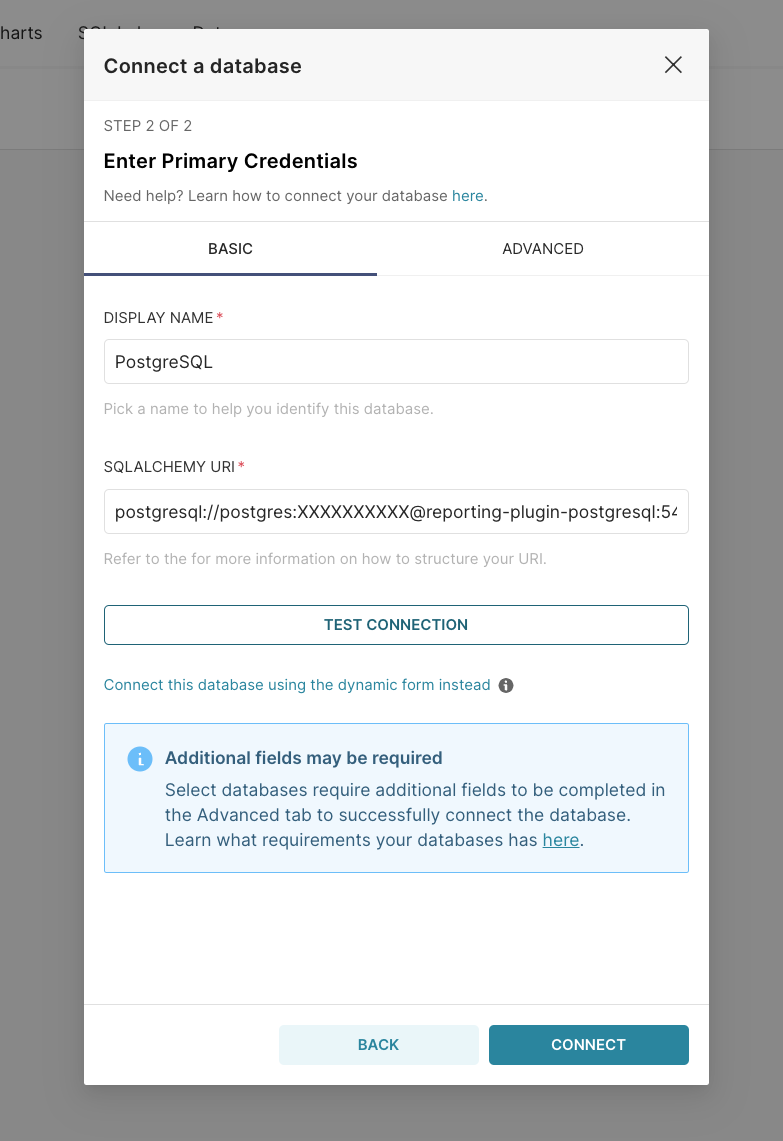
**SQLAlchemy URI** represents the URI of **reporting-db**. The format would look like this: `postgresql://postgres:XXXXXXXXXX@reporting-plugin-postgresql:{{port}}/reporting`.
## Using reporting plugin
Before using the plugin, make sure you marked all the **Data models** and **Processes** you want to include, so they can be further used in the reporting.
### Use in reporting flag
This flag can be used in the following places:
* [**Data model**](../../../../building-blocks/process/process-definition#data-model) - for the keys that must be used in the reporting

* [**Process settings**](../../../../building-blocks/process/process-definition#settings) tab - to include a process definition in reporting.

Now you can use Superset to manipulate the data and create any kind of visuals and dashboards.
### Creating a Chart
There are multiple ways in which you can create/configure a chart.
#### Creating charts using Datasets tab
To create a Chart using the first method, you must follow the next steps:
1. From the top toolbar, select **Data** option tab, then click **Datasets**.
You need to have a dataset added to Superset first. From that particular dataset you can build a visualization.
2. Select the **dataset** you want to work with.
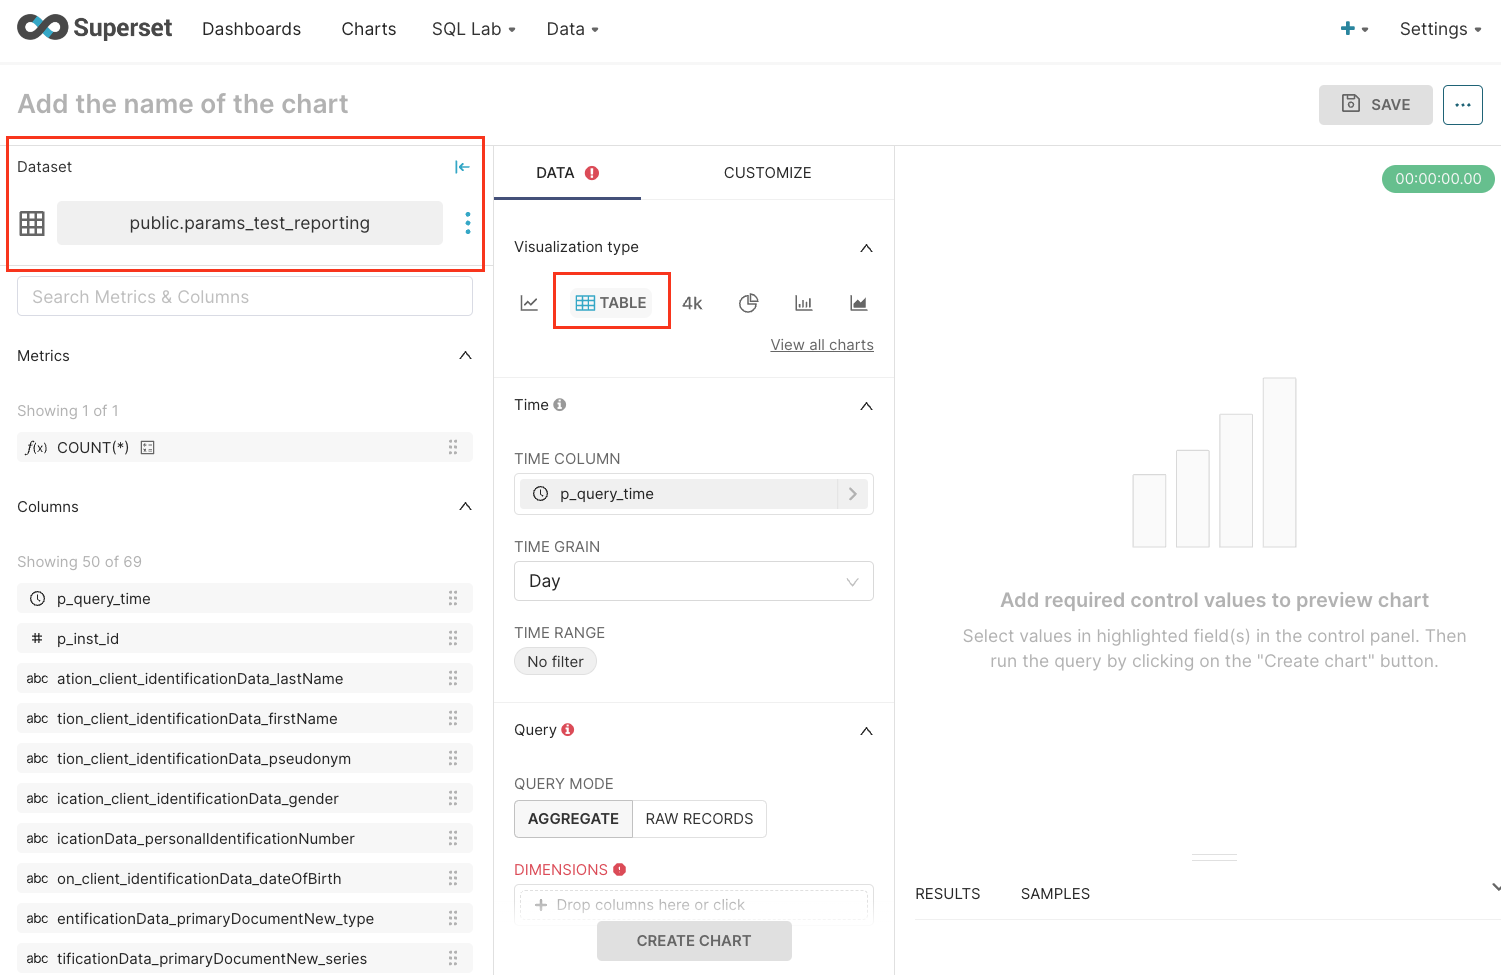
3. After selection, the **explore** page appears.
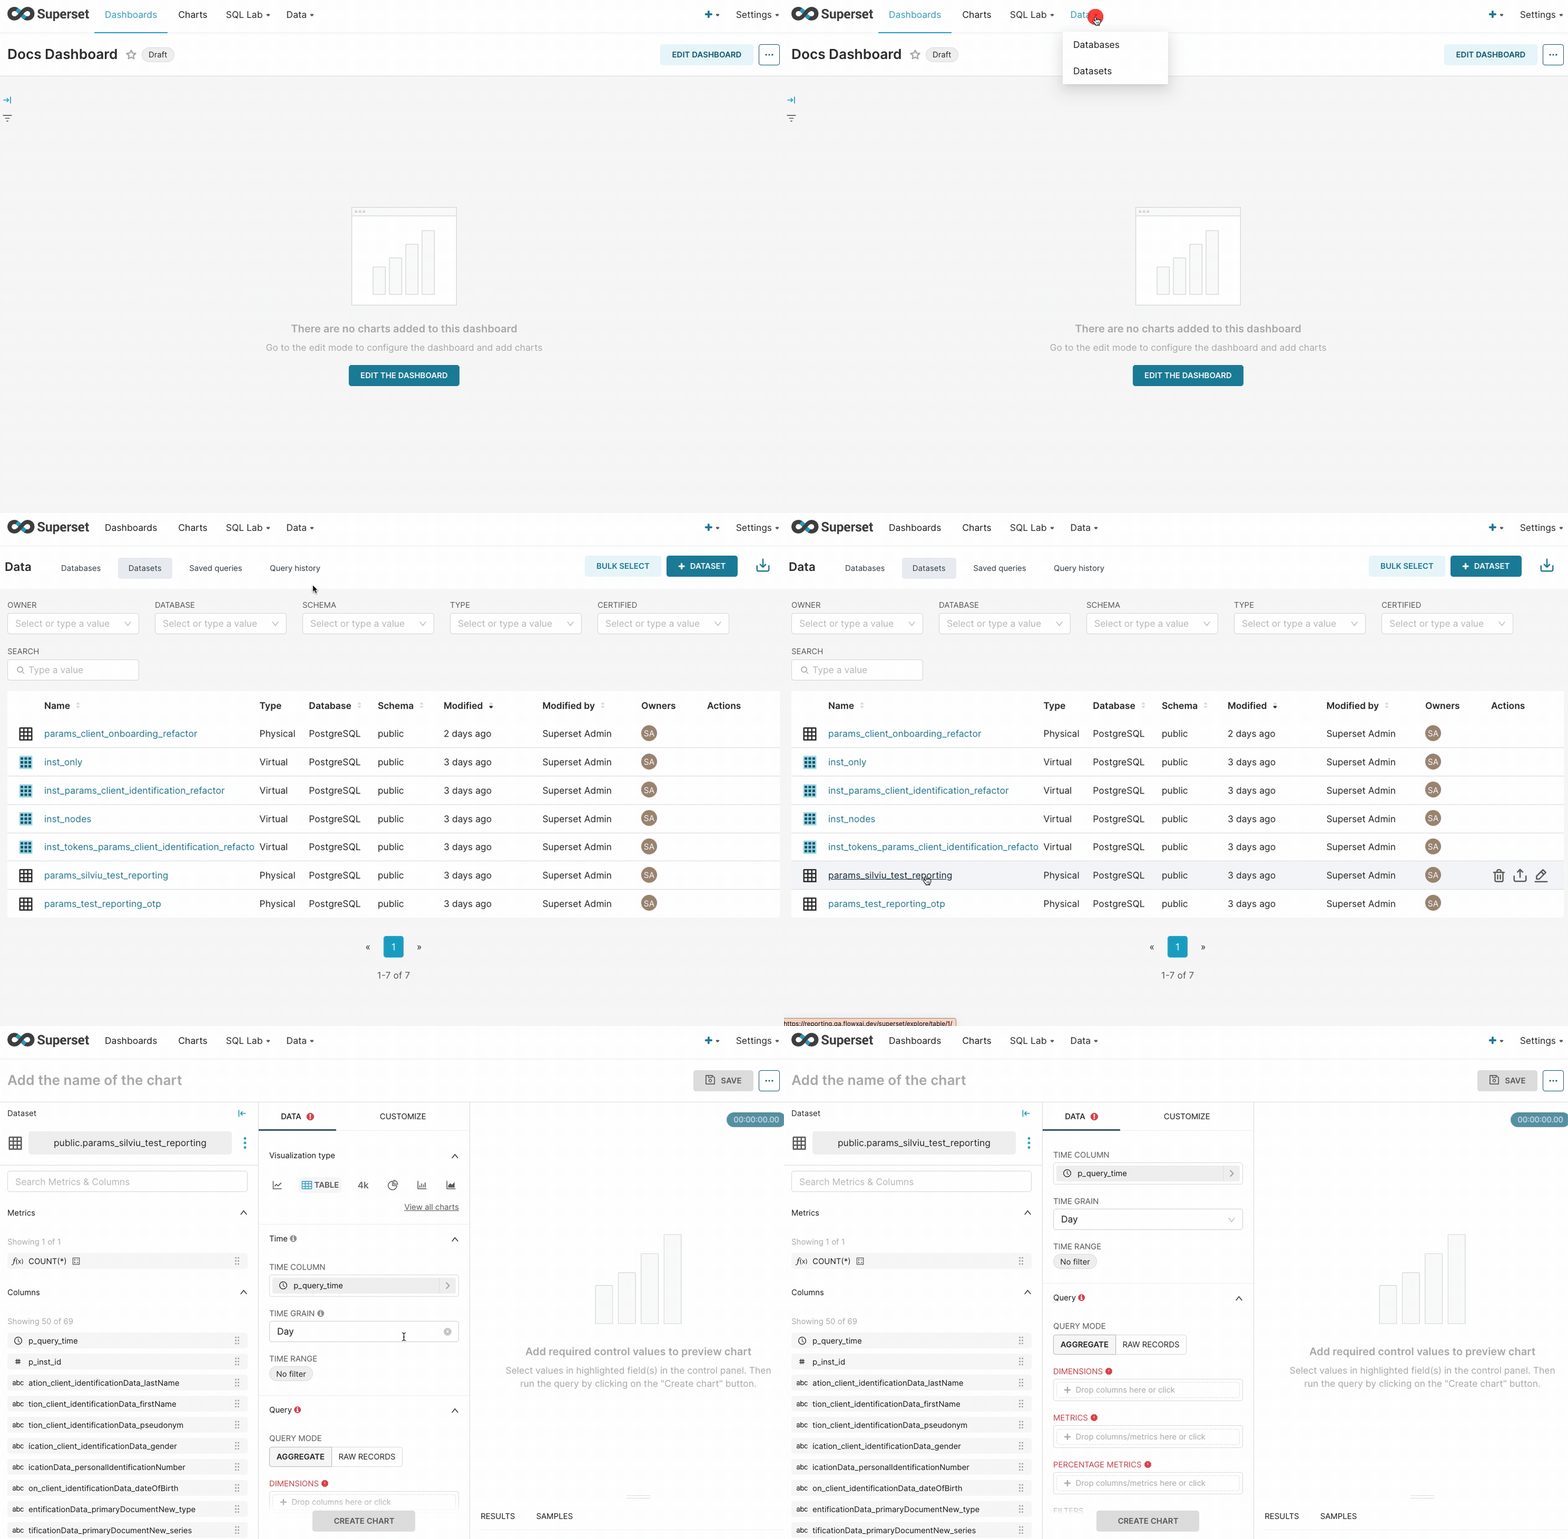
4. When you select a dataset, by default **table** visualization type is selected.
To view all the existent visualization types, click **View all charts**, the charts' gallery will open.
5. Select the **visualization type** and click **Create chart**.
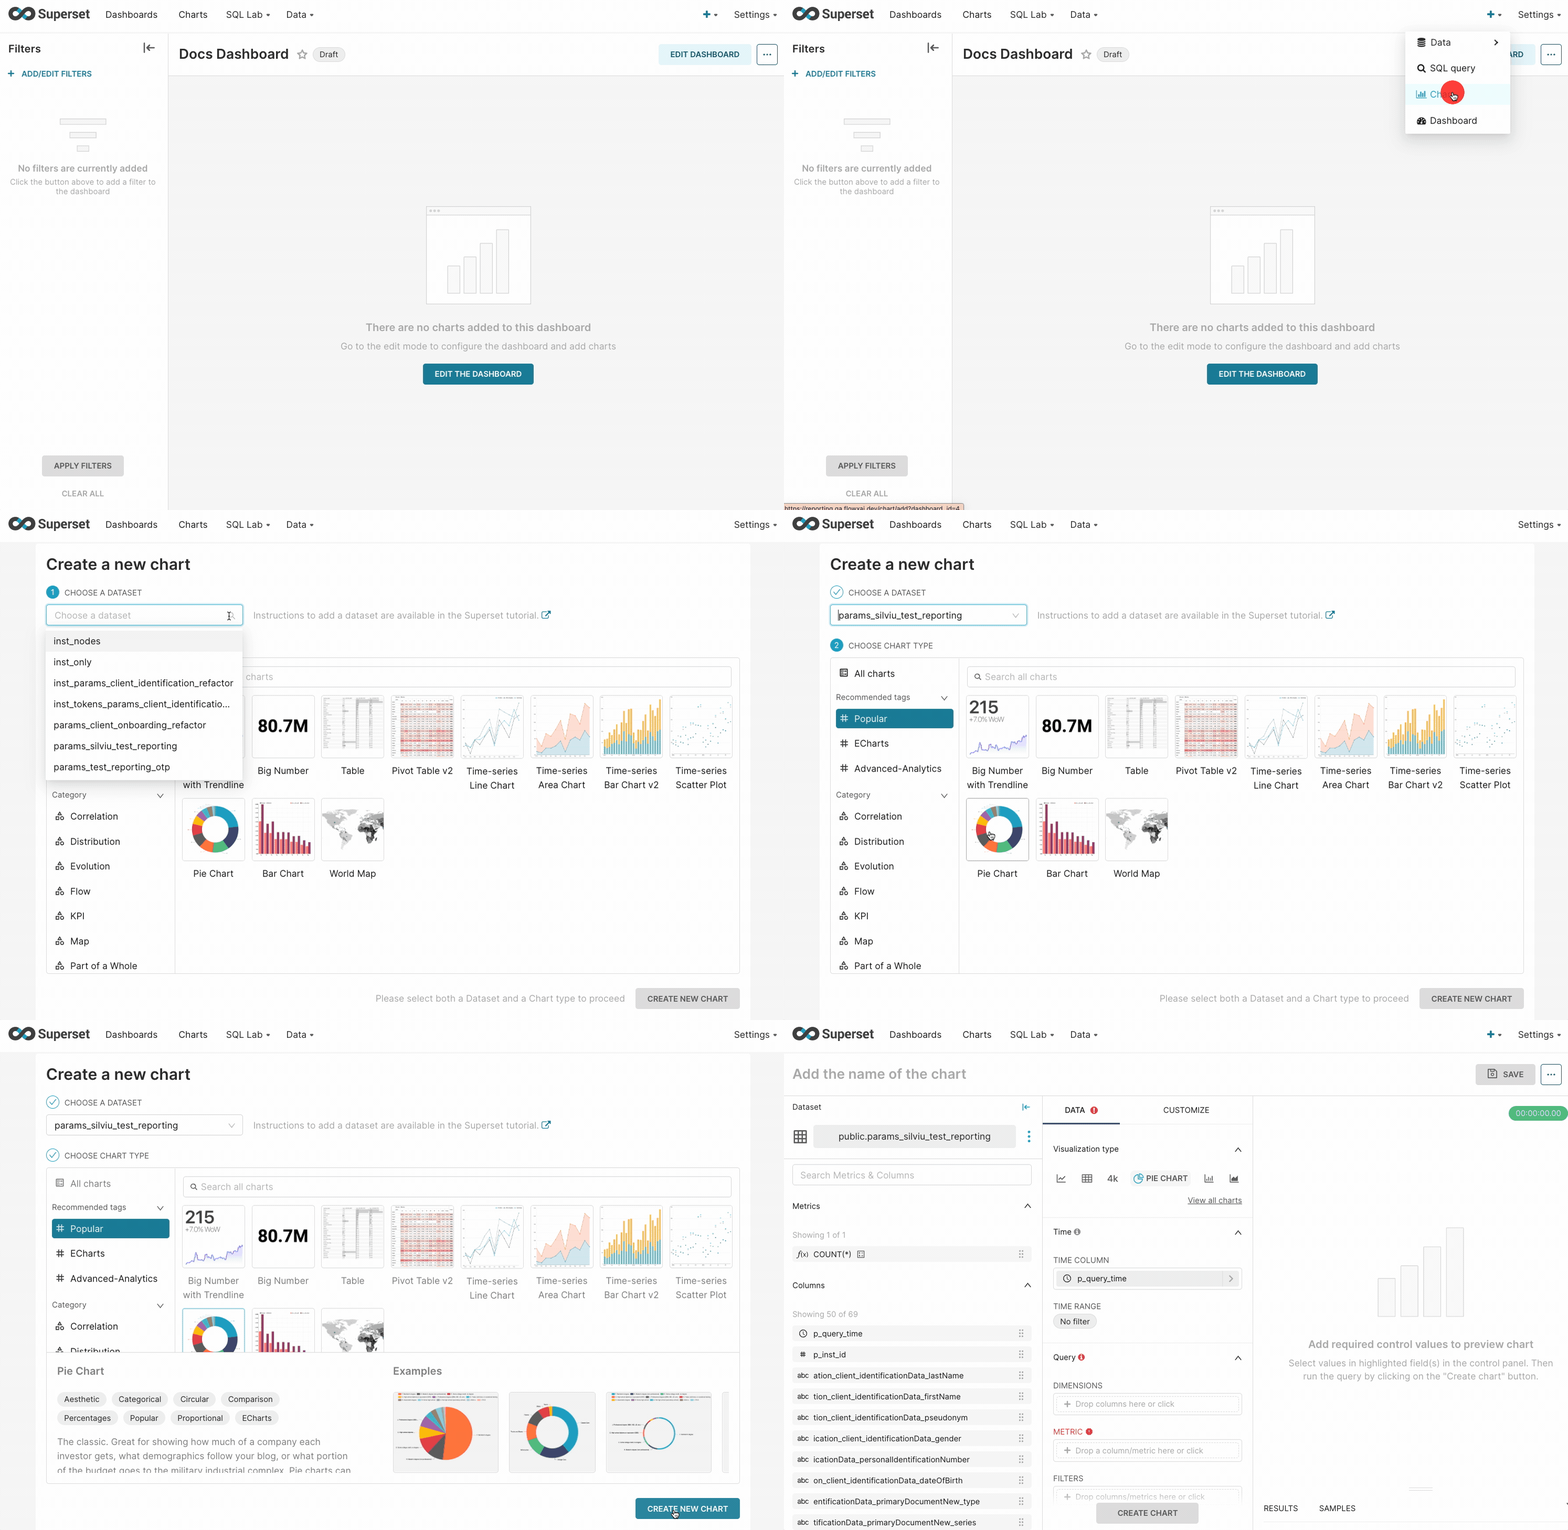
#### Creating charts using Chart gallery
Using Chart gallery is a useful method when you are not quite sure about which char will be best for you.
To create a Chart using the second method, you must follow the next steps:
1. From the **top toolbar**, select **"+"** icon, then select **Chart**.
2. The **Create a new chart** screen appears.
3. Choose the **dataset** that you want to use.
4. The next step is to choose a **chart type**.
If you wish to explore all the chart types available, filter by **All charts**. The charts are also grouped by categories.
5. When you select a chart, at the bottom of the screen you will notice a description of the chart and also example graphics.
6. When you are done with your selection, click **Create new chart**.
### Configuring a Chart
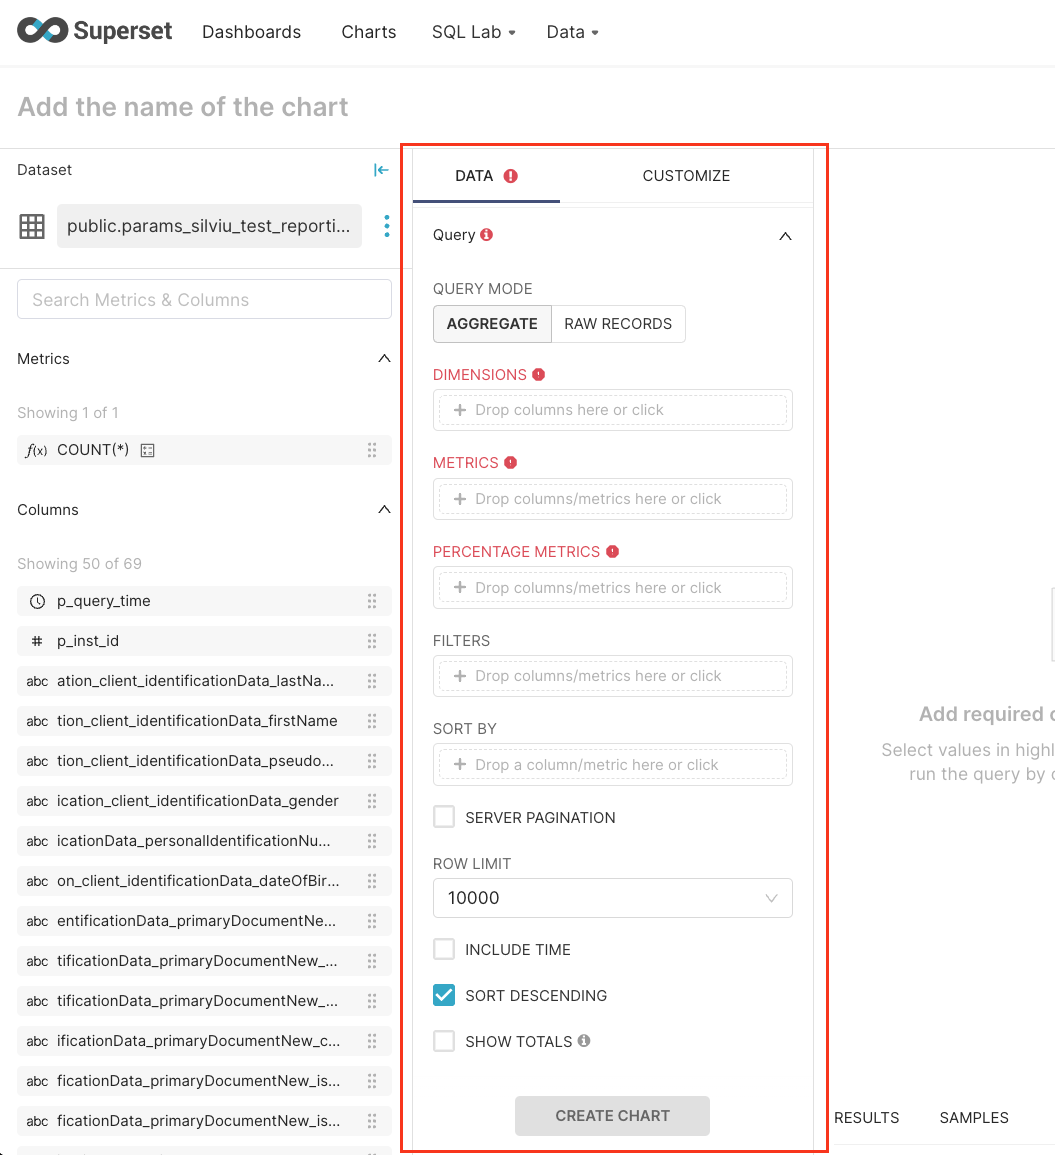
After creating a chart, there are some **Query** fields that muse be configured. This can be easily done by dragging and dropping the relevant columns to the matching fields.
Time and Query form attributes are different, depending on the chart type that you select.
### Exporting/importing a Chart
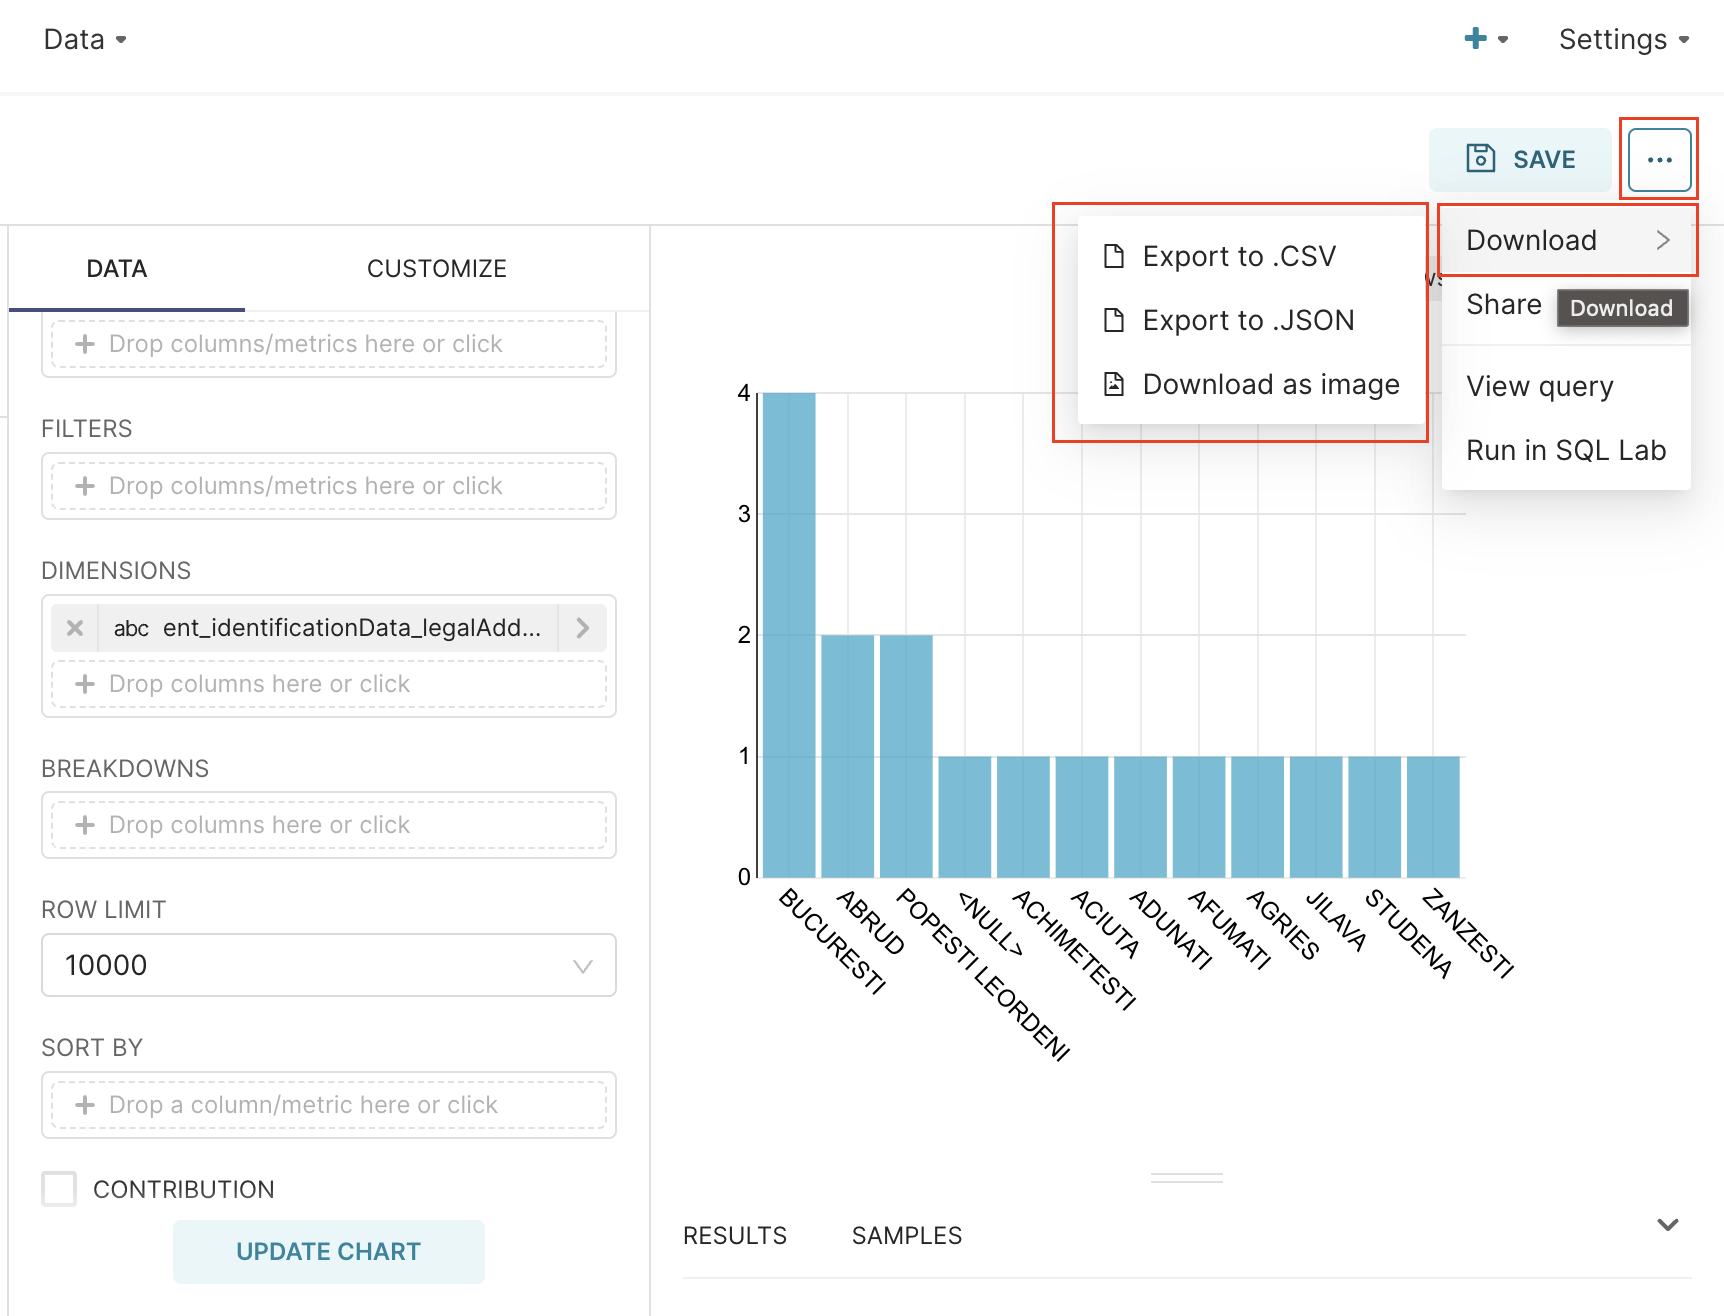
You can export and import charts to help you analyze your data and manipulate dashboards. To export/import a chart, follow the next steps:
1. Open **Superset** and from the top navigation bar, select **Charts**.
2. From the newly opened list, select your **chart**.
3. In the top-right corner, select the **breadcrumbs** menu.
4. Now click **Download**, three options are available:
* Export to .CSV
* Export to .JSON
* Download as image
#### Table example
* **Time** - time related form attributes
* **Query** - query attributes
* **Dimensions** - one or many columns to group by
* **Metrics** - metrics to display
* **Percentage metrics** - metrics for which percentage of total are to be displayed, calculated from only data within the row limit
* **Filters** - metric used for filtering
* **Sort by** - metric used to define how the top series are sorted if a series or row limit is present
* **Row limit** - limits the number of rows that get displayed
### Creating a slice and a dashboard
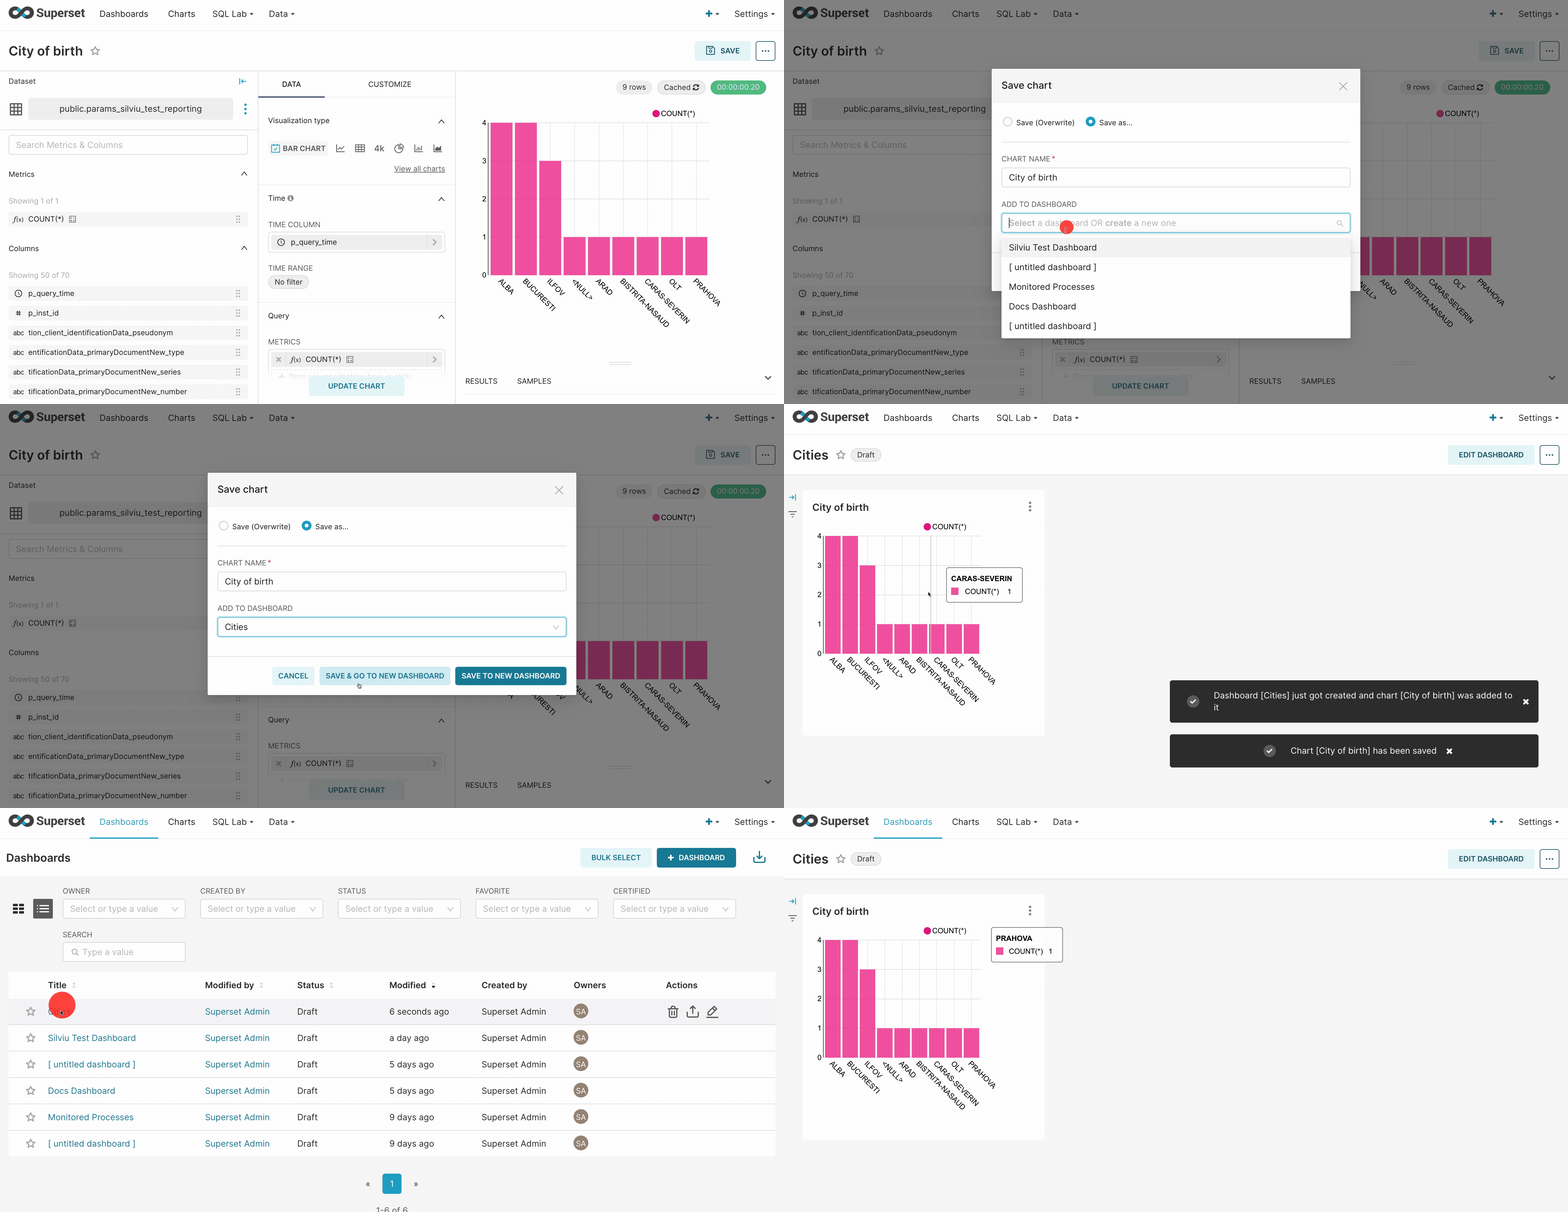
To create a dashboard, while creating a Chart you can choose to add it to a new dashboard. A dashboard will be created automatically.
To create a dashboard follow the next steps:
1. Let's create a new chart called **City of birth** (see the steps above).
2. Now save the newly created **chart** to a new dashboard called **Cities**.
3. To publish, click **Save and go to Dashboard**.
[Reporting setup guide](../../../../../setup-guides/plugins-setup-guide/reporting-setup)
## Related topics
- [Overview](/release-notes/v5.x/v5.0.0-july-2025/migrating-from-v4.7.x-to-5.0/migration-overview.md)
- [FlowX.AI 5.7.0 Release Notes](/release-notes/v5.x/v5.7.0-april-2026/v5.7.0-april-2026.md)
- [FlowX.AI 5.11.0 Release Notes](/release-notes/v5.x/v5.11.0-august-2026/v5.11.0-august-2026.md)